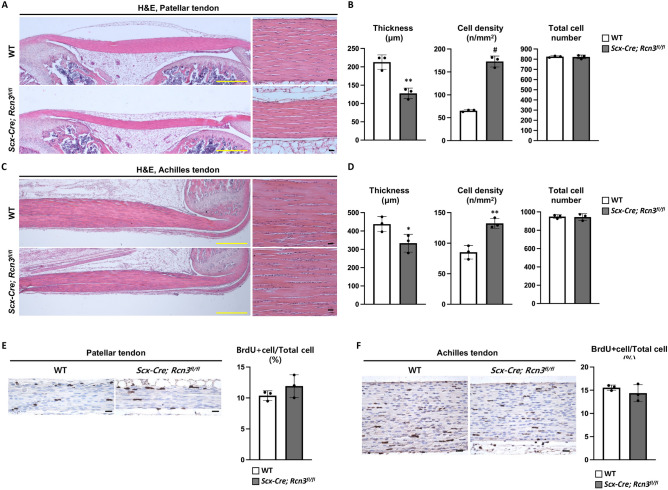
Figure 2.
Histology of patellar and Achilles tendons from wild-type mice and Scx-Cre; Rcn3fl/fl littermates during postnatal tendon development (A,C). The thickness, cell density and total cell number of patellar tendon and Achilles tendon at P30 (B,D). The BrdU staining and quantification of BrdU positive cell ratio in patellar and Achilles tendon at P10 (E,F) (Yellow scale bar indicates 500 µm (A) and black scale bar 20 µm (A,C,E,F), * indicates P < 0.05, ** indicates P < 0.01 and # indicates P < 0.001 between genotypes, n = 3).

