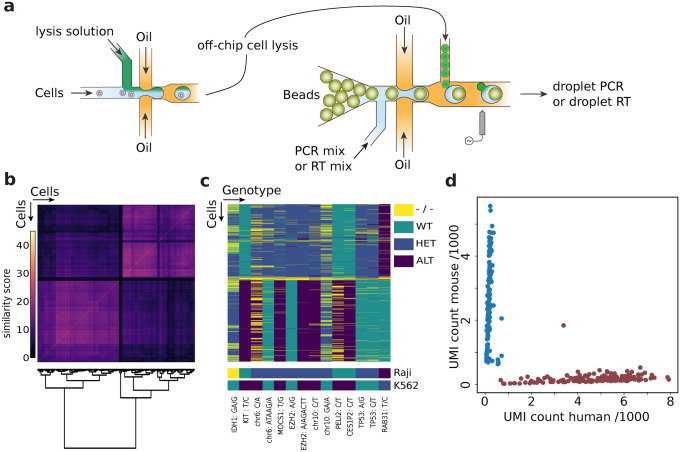
Figure 2.
Singl-cell genotyping with barcode beads. (a) Schematic of the employed microfluidic two step protocol. A cell suspension is co-flowed with porteinase K or detergents and reinjected into a second device after off-chip incubation and heat inactivation of the protease. In the second device droplets with barcode beads are paired with cell lysate and PCR or RT reagents to create barcoded amplicons of targeted genomic regions. (b) Cell–cell similarity matrix based on the number of shared SNPs is given. Cells are ordered along both axes by hierarchical clustering using Ward’s minimum variance method. (c) Cells by genotype matrix, the cells (rows) are in the same order as in (b) and gnomic variants which are different between the two cell lines are given as columns. Genotyping dropouts are indicated in yellow. Bottom rows shows genomic variants detected from homogeneous bulk samples (full variant indexes are given in “Supplementary Data Table”). (d) Single cell RNA sequencing result of the Mouse (3T3) Human (K562) species mixing experiment, counts represent detected unique molecular identifiers in thousands.

