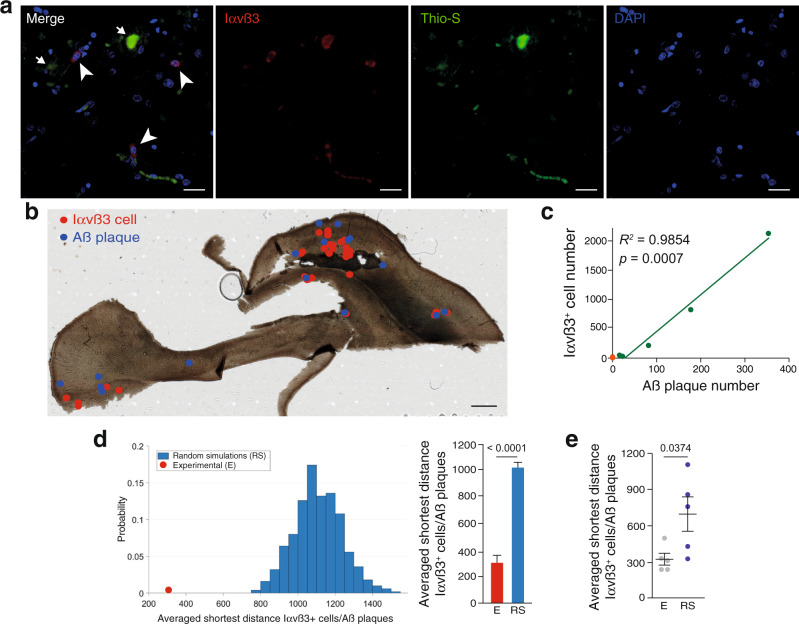
Fig. 2. Angiogenesis is concentrated around Aß plaques in AD.
a A human hippocampal brain slice stained with angiogenic endothelial (Iαvß3; red), Aß (Thio-S; green), and nuclear (DAPI; blue) markers. Scale bar = 20 µm. Arrowheads indicate angiogenic cells and arrows signal Aß plaques. b A human hippocampal brain slice where the position of Iαvß3+ cells (red dots) and Aß plaques (blue dots) are indicated. Scale bar = 1 mm. c Correlation between Iαvß3+ cells and the number of Aß plaques in five AD (Braak IV–VI) cases (green dots). The number of Iαvß3+ cells is also indicated for six control (Braak 0–I) human samples (orange dots). Spearman r correlation. d Left graph, representation of the probability of the averaged shortest distance between Iαvß3+ cells and Aß plaques in 500 random simulations (RS, blue bars) where the Aß plaques position was fixed and the Iαvß3+ cells’ location was randomized. The red dot represents the experimental measurement. Right graph, quantification of the shortest geodesic distance between Iαvß3+ cells and Aß plaques in an experimental (E) and in the first 10 random simulations (RS). Data are presented as mean ± SEM. n = 28 (E) and 280 (RS) Iαvß3+ cells and 16 Aß plaques. Student’s t-test. e Quantification of the averaged shortest geodesic distance between Iαvß3+ cells and Aß plaques from experimental (E) human brain slices and 500 random simulations (RS) of Iαvß3+ cells location. Mean ± SEM. n = 5 human samples; Student’s t-test.

