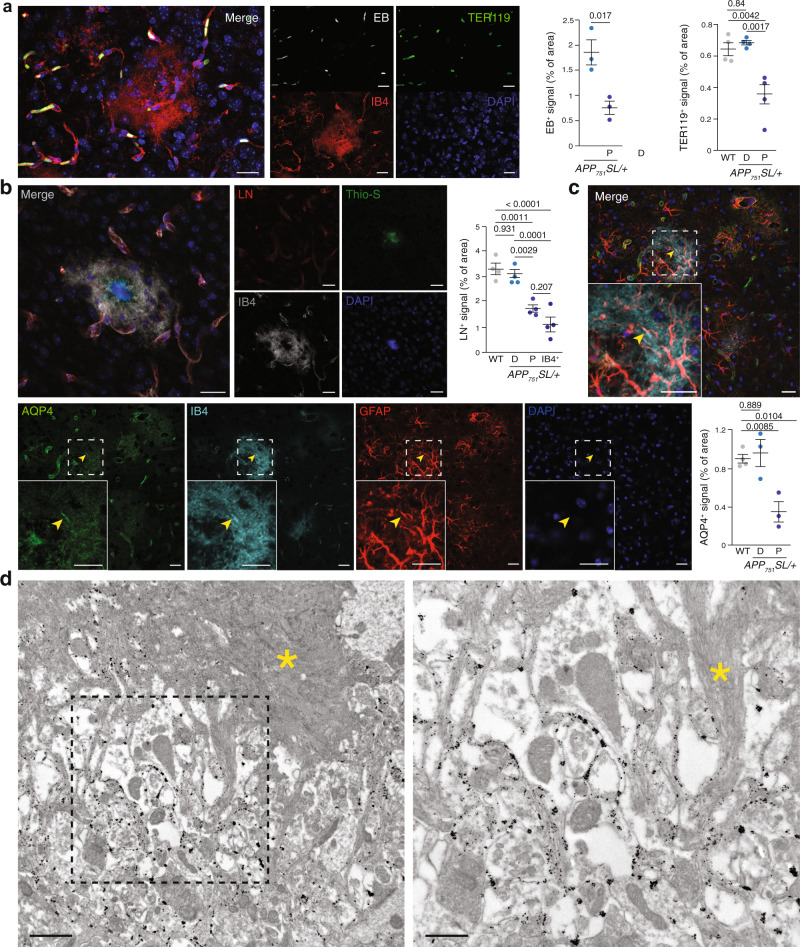
Fig. 5. Vessels are substituted by vascular scars proximal to Aß plaques.
a Left panels, cortical confocal XY images from 8-month-old APP751SL/+ mice stained with endothelial (IB4; red), red cells (TER119; green), Evens Blue (EB, white), and nuclear (DAPI; blue) markers. Scale bar = 20 µm. Right graphs, left, quantification of the EB vessel area distal (D) and proximal (P) to Aß plaques. Mean ± SEM. n = 3 mice; Student’s t-test; right, quantification of the TER119 vessel area in WT, distal (D), and proximal (P) to Aß plaques in APP751SL/+ mice. Mean ± SEM. n = 4 mice; ANOVA, post hoc Tukey’s test. b Left panels, cortical confocal XY images 8-month-old APP751SL/+ mice stained with vessel basement membrane (laminin, LN; red), endothelial (IB4; white), Aß (Thio-S; green), and nuclear (DAPI; blue) markers. Scale bar = 20 µm. Right graphs, quantification of the laminin vessel area in WT mice, in distal (D), proximal (P) to Aß plaques, and inside the IB4+ vascular abnormal structures (IB4+) in 8-month-old APP751SL/+ mice. Mean ± SEM. n = 4 mice; ANOVA, post hoc Tukey’s test. c Cortical confocal projection 8-month-old APP751SL/+ mice stained with astrocytic end-feet (aquaporin 4, AQP4; green), endothelial (IB4; cyan), astrocytic (GFAP, red), and nuclear (DAPI; blue) markers. Insets show the white square from low magnification images. Yellow arrowheads indicate an astrocytic end-feet juxtaposed to an IB4+ structure. Scale bar = 20 µm. Lower graph, left, quantification of the EB vessel area distal (D) and proximal (P) to Aß plaques. Mean ± SEM. n = 4 WT and 3 APP751SL/+ mice; ANOVA, post hoc Tukey’s test. d Electron microscopy analysis of an 8-month-old APP751SL/+ cortex stained with IB4 (black dots, gold particles). Right image is a high magnification of the left dashed square shown in the left panel. A yellow asterisk indicates an Aß plaque. Scale bar = 1 µm in low and 0.5 µm in high magnification images.

