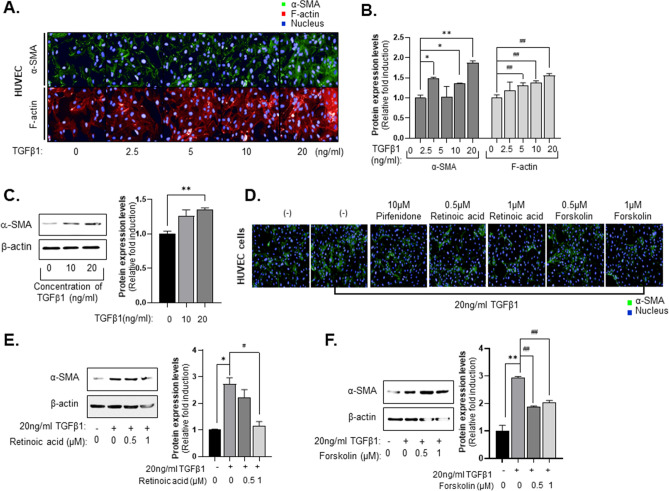
Figure 4.
Anti-fibrosis effects of hit compounds in phenomic-based 2D assay of endothelial cells (HUVECs). (A) Intensity of α-SMA and F-actin in HUVEC cells in 2D culture system treating with TGF-β1. Cells were treated with 2.5, 5, 10, or 20 ng/ml TGF-β1 (B) Calculated intensity of α-SMA and F-actin when HUVEC cells were treated with TGF-β1 concentration. (C) α-SMA expression (left panel) and the quantitative of western blot image was analyzed (right panel) depending on treating with TGF-β1 concentration in HUVEC cells. (D) Representative images of α-SMA treated with 10 µM of pirfenidone, 0.5 µM or 1 µM of retinoic acid and forskolin with 20 ng/ml TGF-β1 for 48 h in HUVEC cells. (E,F) Expression of α-SMA when HUVEC cells were treated with 0.5 or 1 µM (E) Retinoic acid or (F) Forskolin. All images were obtained using the Operetta CLS system. Data are expressed as means ± SD (n = 3). *P < 0.05 and **P < 0.01 compared to the control group, #P < 0.05 and ##P < 0.01 compared to the TGF-β1 treatment group.

