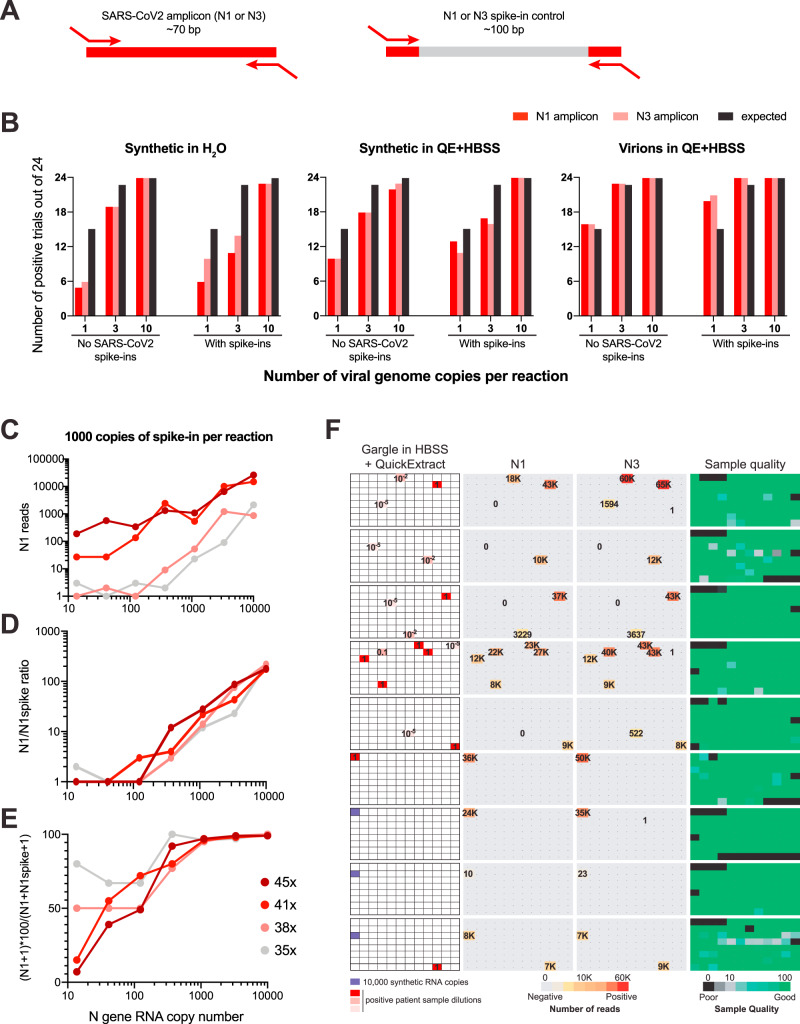
Fig. 3. SARSeq is specific and sensitive when tested on a large set of gargle samples.
A Schematic illustration of RNA spike-ins to scavenge N1 and N3 primers during PCR1 in SARS-CoV-2-negative samples. Analogous to the RTC, primer binding sites are identical to N1/3 amplicons, but intermediate sequence is distinct and longer so as not to compete with virus-derived amplicons. B Frequency of detection of SARS-CoV-2 at minimal template concentration. Number of detected cases out of 24 trials is depicted. Note that the expected frequency of detection is only 63% and 95% for one and three molecules, respectively, assuming a Poisson distribution of molecules in wells. C Read counts of N1 amplicons in a synthetic SARS-CoV-2 N gene RNA dilution series, in the presence of 1000 copies of N1 spike-in per reaction, obtained after 35, 38, 41, or 45 PCR1 cycles. D Ratio of N1 to N1 spike-in reads from the same experiment as in C. E Percentage of specific reads generated by the N1 primer pair that correspond to the N1 amplicon from the same experiment as in C. F SARSeq performance on a test pool of 864 gargle samples collected in HBSS from healthy participants of a routine SARS-CoV-2 testing pipeline. These were spiked with synthetic SARS-CoV-2 RNA or a dilution series generated from a positive patient sample (with a Ct = 30). All negative samples produced 0–1 N1/3 reads, while positive samples produced thousands. The only missed samples were 10−5-fold dilutions of the patient sample, which presumably did not contain SARS-CoV-2 RNA anymore at that concentration. Sample quality is assessed by the ratio or ribosomal reads to RTC spike-in.

