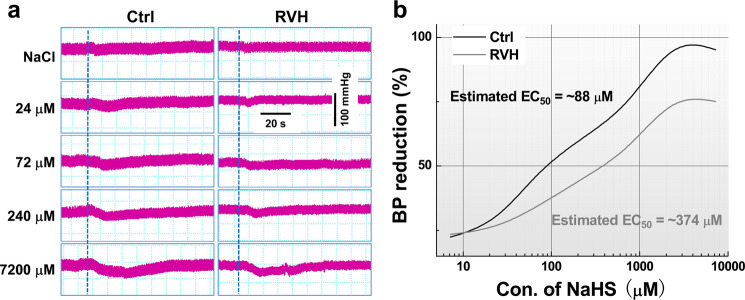
Fig. 3. Changes in blood pressure by the microinjection of NaHS into the NG under physiological and hypertensive conditions (concentration-dependent effects of NaHS on blood pressure by NG microinjection).
a Representative BP recordings before and after the administration of saline (top) and NaHS at various doses (24, 72, 240, and 7200 μM, 0.3 μL) to control (left) and RVH (right) rats. The dashed line indicates the time at which treatment began. b Recording of the change in BP after the administration of NaHS at different doses (7.2, 24, 72, 240, 720, 2400, and 7200 μM, 0.3 μL). With the NaHS concentration as the abscissa and the percentage of BP reduction as the ordinate, dose-effect relationship curves for NaHS in Ctrl (black curve, n = 5–7 rats/group) and RVH (grey curve, n = 5 or 6 rats/group) rats were established. EC50: concentration that provides 50% of the maximal effect.

