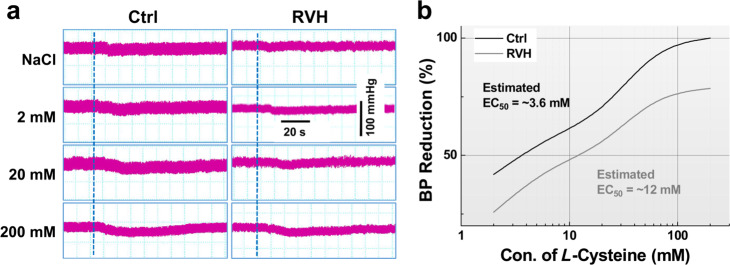
Fig. 4. Concentration-dependent effects of L-cysteine on blood pressure by microinjection into the NG.
a Representative BP recordings before and after the administration of saline (top) and L-cysteine at different doses (2, 20, and 200 mM, 0.2 μL) in Ctrl (left) and RVH (right) rats; the dashed line indicates the time at which treatment began. b Representative recordings of BP before and after the administration of L-cysteine at different doses (2, 6, 20, 60, 200 mM, 0.2 μL). With the L-cysteine concentration used as the abscissa and the percentage of BP reduction used as the ordinate, the dose-effect relationship curves for L-cysteine in Ctrl (black curve, n = 5–7 rats/group) and RVH (grey curve, n = 5 or 6 for rats/group) rats were established.

