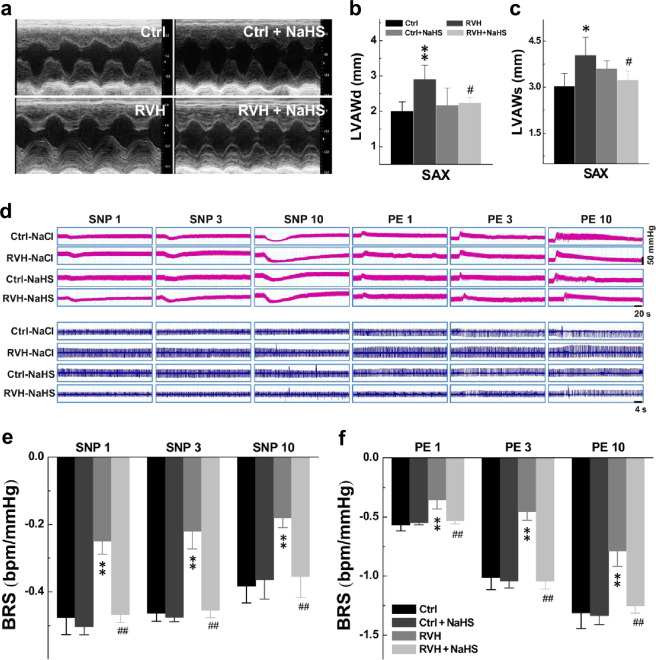
Fig. 6. Cardiovascular effects of long-term intravenous H2S administration in normal and hypertensive model rats.
a Image showing the cardiac morphology of Ctrl, Ctrl + NaHS (4 weeks), RVH, RVH + NaHS (4 weeks) rats in the SAX model. b, c Diastolic LVAW (LVAWd, mm; n = 5 rats/group) and systolic LVAW (LVAWs, mm; n = 5 rats/group). Averaged data are presented as the mean ± SD; *P < 0.05 and **P < 0.01 vs. the Ctrl group, #P < 0.05 vs. the RVH group. d Representative recordings of the MAP collected from rats in the presence of 1, 3, and 10 μg ·kg−1 PE or SNP. Representative recordings of the heart rate (HR) along with changes in blood pressure (BP). e, f Summarized changes in BRS (ΔHR/ΔMAP, bpm/mmHg) upon treatment with PE followed by SNP at different concentrations in each group are shown. Averaged data are presented as the mean ± SD; n = 5 rats/group. **P < 0.01 vs. the Ctrl group, ##P < 0.01 vs. the RVH group.

