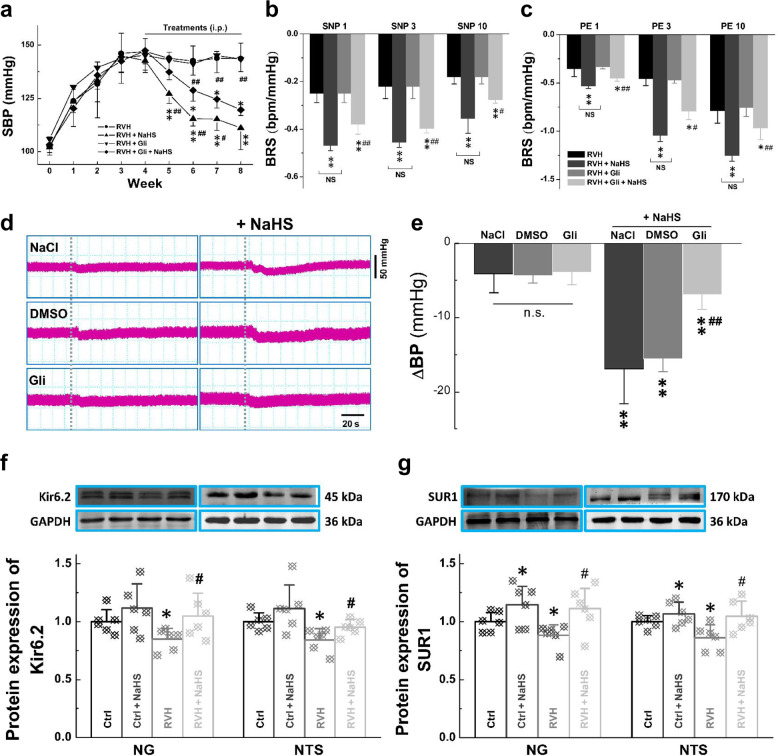
Fig. 8. Expression of H2S-mediated ATP-sensitive K+ channels (Kir6.2 and SUR1) in the NG and NTS.
a The noninvasive systolic SBP (mmHg) was measured weekly from RVH, RVH + NaHS, RVH + Gli, and RVH + Gli + NaHS rats. Averaged data are presented as the mean ± SD. n = 5 rats/group. *P < 0.05 and **P < 0.01 vs. the RVH group, #P < 0.05 and ##P < 0.01 vs. the RVH + Gli + NaHS group. b, c Summarized changes in BRS (ΔHR/ΔMAP, bpm/mmHg) upon treatment with PE followed by SNP at different concentrations in each group. n = 5 rats/group. **P < 0.01 vs. the RVH group, #P < 0.05 and ##P < 0.01 vs. the RVH + NaHS group. n.s.: no significance. d, e Effect of the KATP channel blocker Gli on H2S-mediated transient hypertension; blood pressure (BP) was measured before and after pretreatment (Gli, 1.5 μg/kg, a KATP channel inhibitor; NaCl; DMSO) and NaHS (100 μM) treatment by microinjection into the NG. The change in BP after administration of the drugs was recorded. Averaged data are presented as the mean ± SD. n = 7 rats/group. **P < 0.01 vs. the corresponding pretreatment group; ##P < 0.01 vs. the DMSO + NaHS group. f, g Western blot analysis of Kir6.2 and SUR1 protein expression in the NG (n = 6 duplicates/group) and NTS (n = 6 duplicates/group) from Ctrl, Ctrl + NaHS, RVH, and RVH + NaHS rats. Gray value analysis was performed to quantify Kir6.2 and SUR1, and the data are presented as a fold change after normalization to control values. Averaged data are expressed as the mean ± SD; *P < 0.05 vs. the Ctrl group; #P < 0.05 vs. the RVH group.

