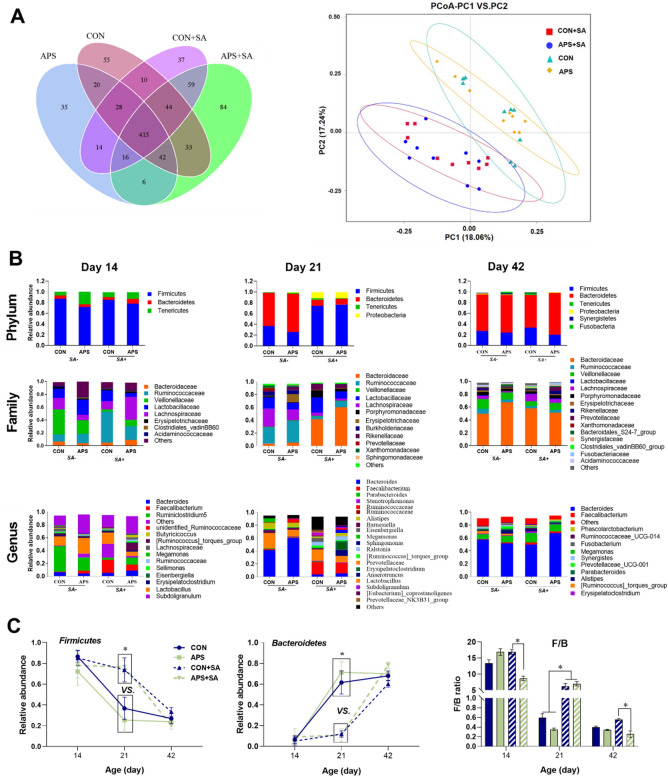
Figure 3.
The OTU numbers and relative abundance values in the cecal microbiota at the phylum, family, and genus levels. (A) OTU number Venn plot and PCoA score plot for the different groups, (B) Relative abundance values in the cecal microbiota of broilers at 14, 21 and 42 days of age at the phylum, family, and genus levels, (C) Changes in the abundance values of the dominant phyla Firmicutes and Bacteroidetes and their ratio (F/B) in different ages of broilers. Only microbes that had a mean relative abundance greater than 1% are displayed in this figure. CON, control pair-fed group; APS, APS-supplemented pair-fed group; CON + SA, control S. ser. Enteritidis-challenged group; APS + SA, APS-supplemented S. ser. Enteritidis-challenged group; SA + , S. ser. Enteritidis-challenged groups; SA-, pair-fed groups.

