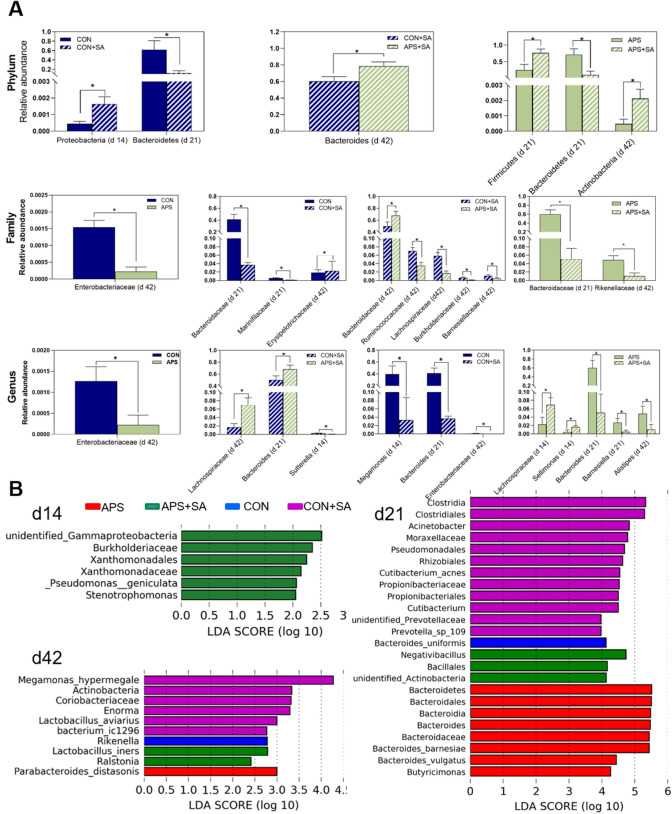
Figure 4.
Cecal microbes with significant (P < 0.05) discrepancies in abundance among the different groups. (A) Differences in abundance at the phylum, family, and genus levels. The x-axis shows the microbes at the phylum, family, or genus level, and the numbers in parentheses indicate the ages of the broilers, (B) LefSe analysis of the cecal microbial communities in broilers from the CON, APS, CON + SA and APS + SA groups at 14, 21, and 42 days of age. The LDA histogram shown the microbial species with significant (P < 0.05) differences in different groups.

