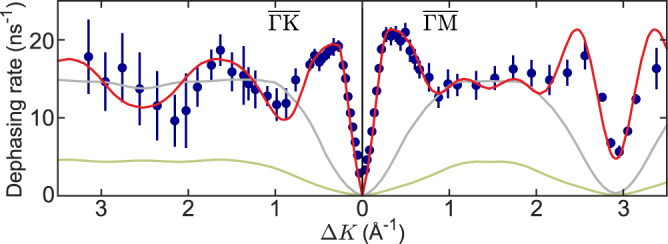
Fig. 5. Evidence for repulsive interactions in the diffusion process.

Experimental dephasing rates for coherent scattering (blue dots, with the error bars correspnding to the 1σ confidence bounds) compared with kinetic Monte Carlo simulations (solid curves). The simulations add a force (Eq. (4)) to the hopping model derived earlier. The experimental data are described well by repulsive dipole forces (red curve) but models using attractive forces (green curve) or no forces (grey curve) cannot reproduce the data. Note that the model without forces (grey curve) is, as expected, similar to the analytic curve for incoherent scattering shown in Fig. 1.
