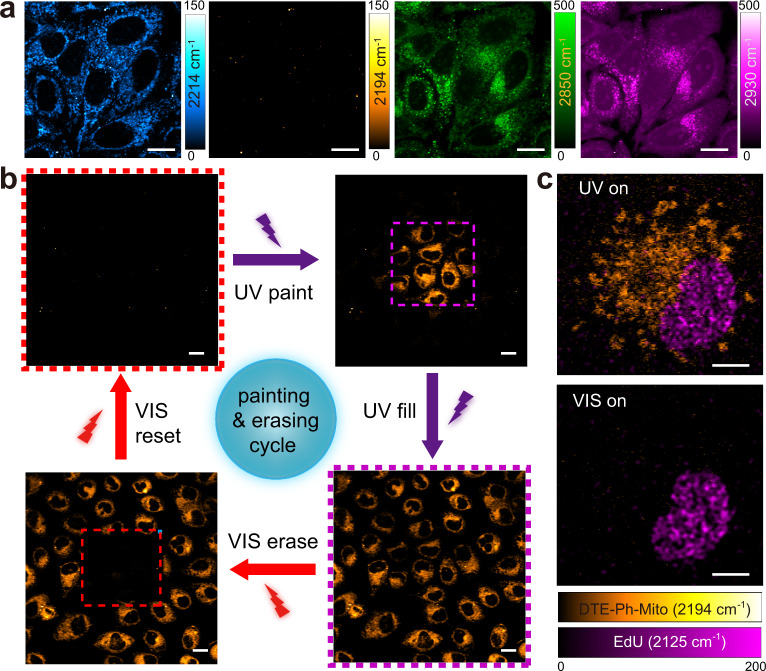
Fig. 3. Live cell painting and erasing with SRS microscopy.
a DTE-Ph-Mito labeled live HeLa cells imaged at different Raman frequencies: alkyne stretches of the open- (2214 cm−1) and closed-ring (2194 cm−1) isomers, CH2 symmetric stretch (2850 cm−1) and CH3 symmetric stretch (2930 cm−1). b The cell painting and erasing cycle, through the processes of painting a subset of the cells, lighting (filling) up the whole FOV, erasing a subset of the cells and resetting the whole FOV to the “off” state, using controlled UV/visible irradiations in the purple/red dashed squares. c Dual-color SRS imaging of DTE-Ph-Mito (mitochondria targeting) and EdU (nucleus targeting) co-cultured cells under different irradiation conditions. Scale bars: 5 µm in (c), 10 µm in (a), and 20 µm in (b).

