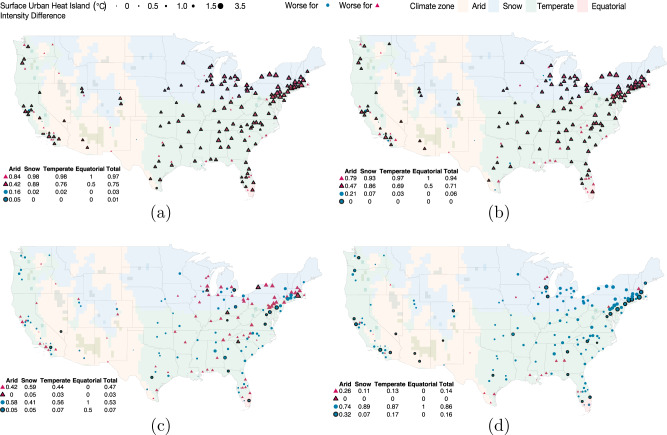
Fig. 2. Sociodemographic differences in mean summer daytime surface urban heat island intensity by major urban area.
Symbols outlined in black depict statistically significant differences in mean exposures (p < 0.05). Tables embedded in the lower left-hand corners indicate proportion of cities in each category (e.g., worse for ▵ or worse for ◦) by climate zone. Supplementary Table 1 provides detailed results for each city. Hispanic is defined as all who report “Hispanic, Latino, or Spanish origin” as their ethnicity, regardless of race. People of color includes all Hispanic and all who do not identify as white alone. a Non-Hispanic white (◦) and people of color (▵). b Above 2 × poverty (◦) and below poverty (▵). c Below poverty (◦) and people of color (▵). d Below 65 (◦) and above 65 (▵).

