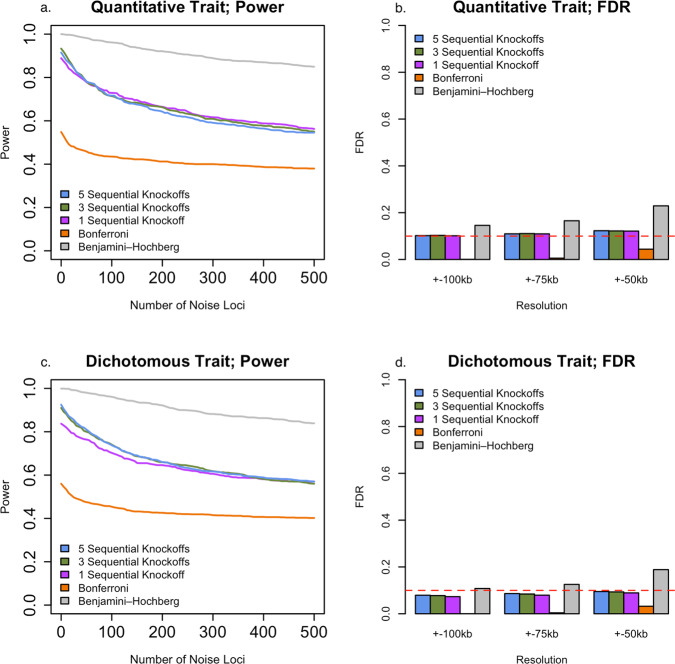
Fig. 3. Genome-wide power and false discovery rate (FDR) simulations studies in the presence of multiple causal loci.
a, c Empirical power for different types of traits (quantitative and dichotomous), defined as the average proportion of 200 kb causal loci being identified at target FDR 0.1. b, d Empirical FDR for different types of traits (quantitative and dichotomous) at different resolutions, defined as the proportion of significant windows (target FDR 0.1) ± 100/75/50 kb away from the causal windows. The empirical power and FDR have averaged over 100 replicates. Source data are provided as a Source Data file.

