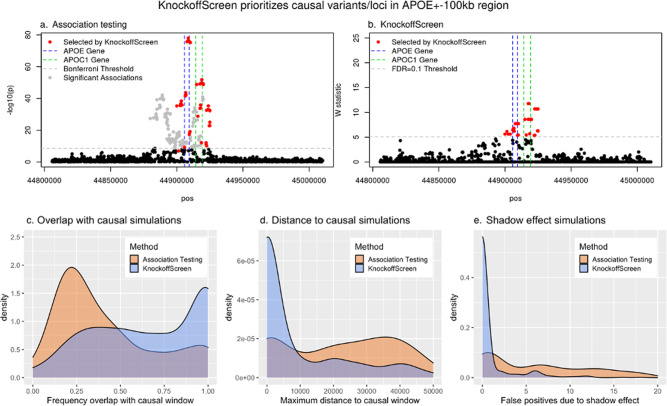
Fig. 4. KnockoffScreen prioritizes causal variants/loci and distinguishes the signal due to rare variants from shadow effects of significant common variants nearby.
a, b Results of the data analyses of the APOE ± 100 kb region from the ADSP data. Each dot represents a window. Windows selected by KnockoffScreen are highlighted in red. Windows selected by conventional association testing but not by KnockoffScreen are shown in gray. c–e Simulation results based on the APOE ± 100 kb region, comparing the conventional association testing and KnockoffScreen methods in terms of c, frequency of selected variants/windows overlapping with the causal region; d Maximum distance of selected variants/windows to the causal region; e number of false positives due to shadow effect. The target FDR is 0.1. The density plots are based on 500 replicates. Source data are provided as a Source Data file.

