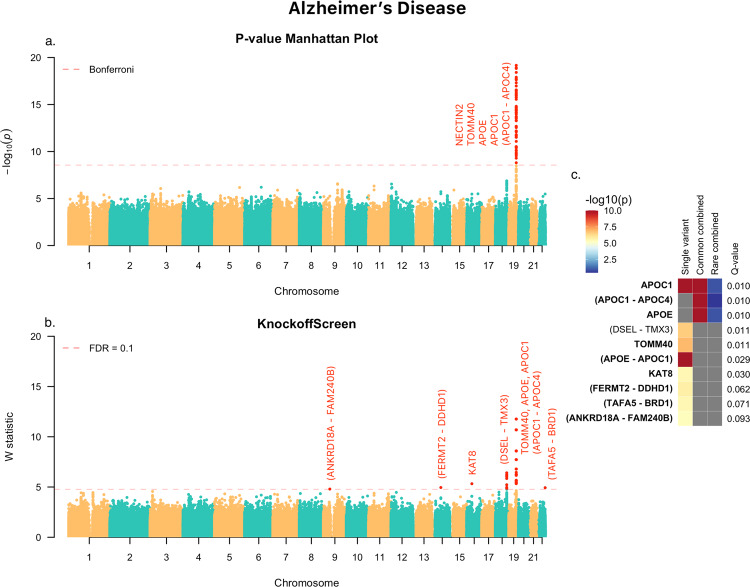
Fig. 6. KnockoffScreen application to the Alzheimer’s Disease Sequencing Project (ADSP) data to identify variants associated with the Alzheimer’s Disease.
a Manhattan plot of p-values (truncated at for clear visualization) from the conventional association testing with Bonferroni adjustment (/number of tested windows) for FWER control. b Manhattan plot of KnockoffScreen with target FDR at 0.1. c heatmap that shows stratified p-values (truncated at for clear visualization) of all loci passing the FDR = 0.1 threshold, and the corresponding Q-values that already incorporate correction for multiple testing. The loci are shown in descending order of the knockoff statistics. For each locus, the p-values of the top associated single variant and/or window are shown indicating whether the signal comes from a single variant, a combined effect of common variants or a combined effect of rare variants. The names of those genes previously implicated by GWAS studies are shown in bold (names were just used to label the region and may not represent causative gene in the region). Source data are provided as a Source Data file.

