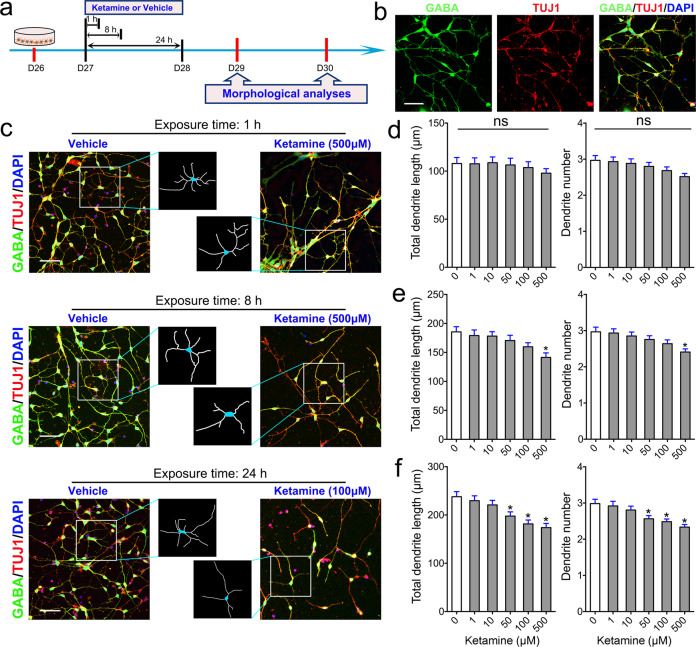
Fig. 2. Effects of ketamine on MSN dendritic growth.
a Schematic and timeline of the experiments. b Representative images of selective markers of striatal MSNs. Color legend: green, GABA; red, TUJ1; blue, DAPI. Scale bar = 50 μm. c Comparison of the morphology of MSNs in the vehicle and ketamine groups after 1, 8, and 24 h of exposure. The box shows magnified and traced neurons in each group. Scale bar = 50 μm. d–f Morphometric assessment of MSNs 48 h after ketamine (1–500 μM) or vehicle treatment for 1 h (d), 8 h (e), or 24 h (f). Two structural plasticity parameters were measured, namely, total dendritic length and dendrite number. In all panels, the data are expressed as the mean ± SEM; ns not significant; *P < 0.05 vs. the vehicle group.

