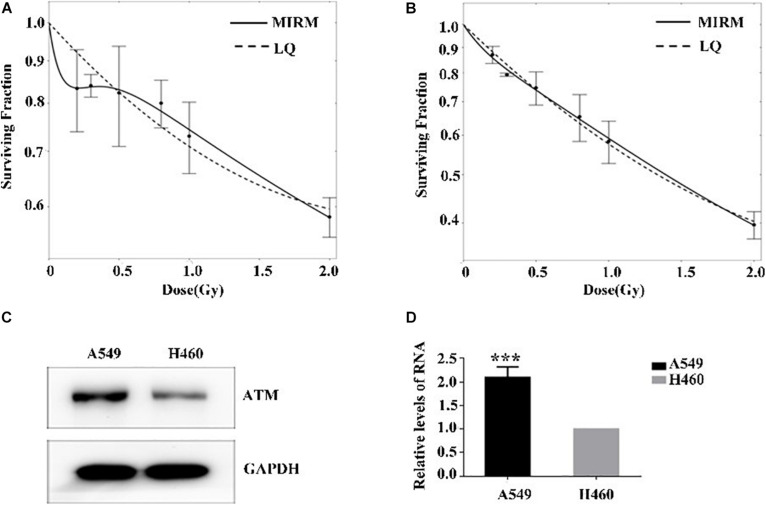
FIGURE 1.
Low-dose radiosensitivity and ATM protein expression in A549 cells and H460 cells. (A) A549 cells showed radioresistance to 0.3–0.5 Gy. (B) The radiosensitivity of H460 cells was dose-dependent. (C,D) The mRNA and protein levels of ATM in A549 cells were both higher than those of H460 cells. *** p < 0.001.

