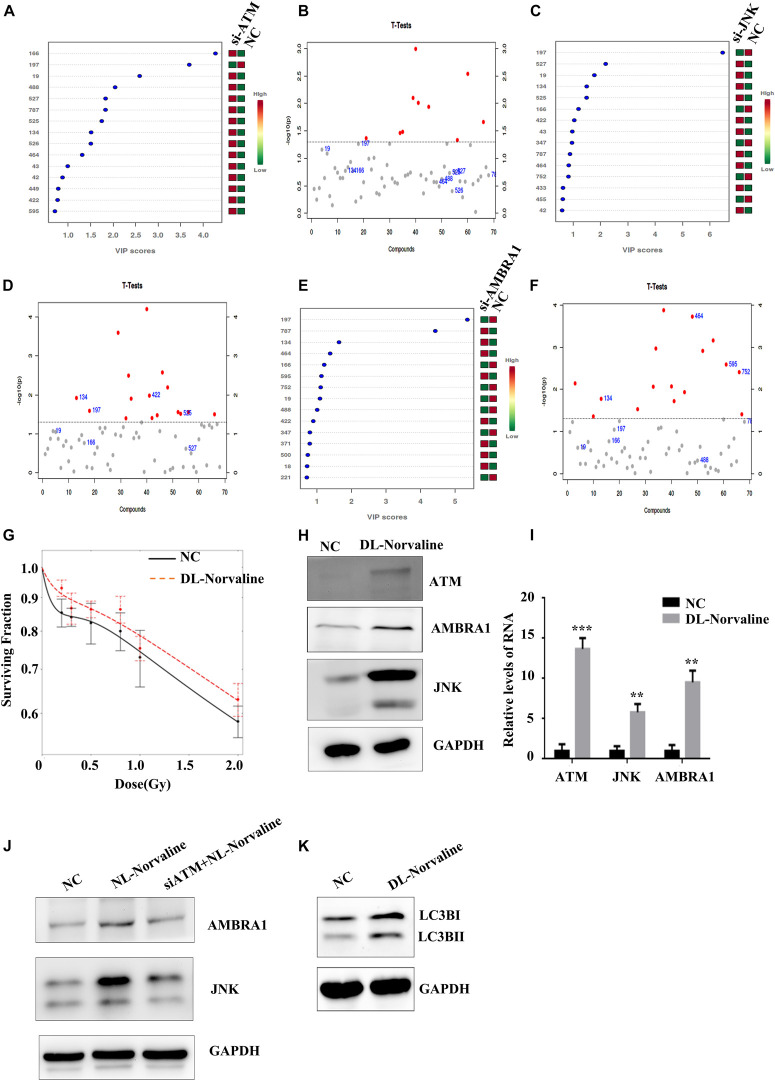
FIGURE 6.
Metabolic processes associated with the low-dose HRS phenomenon. (A,B) Differences in metabolites between the ATM-knockdown group and the control group. (C,D) Differences in metabolites between the JNK-knockdown group and the control group. (E,F) Differences in metabolites between the AMBRA1-knockdown group and the control group. (G) Effect of DL-Norvaline on the low-dose radiosensitivity of A549 cells. (H,I) Effect of DL-Norvaline on the expression levels of ATM, JNK, and AMBRA1 in A549 cells. (J) Effect of siRNA knockdown of ATM on the DL-Norvaline effect. (K) Effect of DL-Norvaline on autophagy ***p < 0.001, **p < 0.01.

