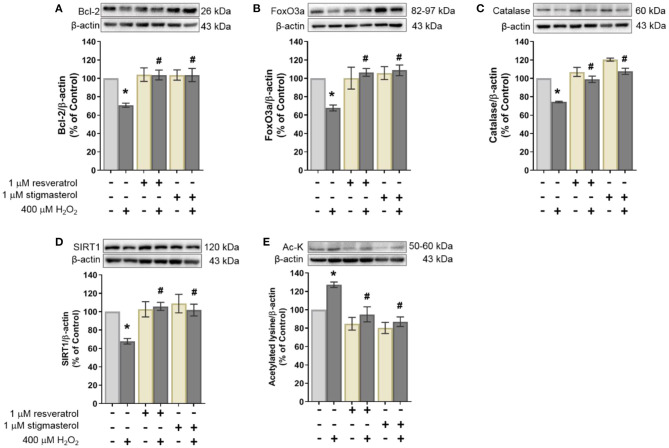
Figure 4.
Effects of resveratrol and stigmasterol on the expression level of (A) anti-apoptotic protein Bcl-2, (B) FoxO3a, (C) catalase, (D) SIRT1, and (E) acetylated lysine (Ac-K). Representative of protein bands determined by Western blot with β-actin as loading control are presented at the upper panel. Quantification of protein expression level is presented as ratios of each protein/β-actin protein band intensity relative to the control group. Data are shown as the mean of three independent experiments ± S.E.M. (*p < 0.05 vs. control; #p < 0.05 vs. H2O2-treated group).

