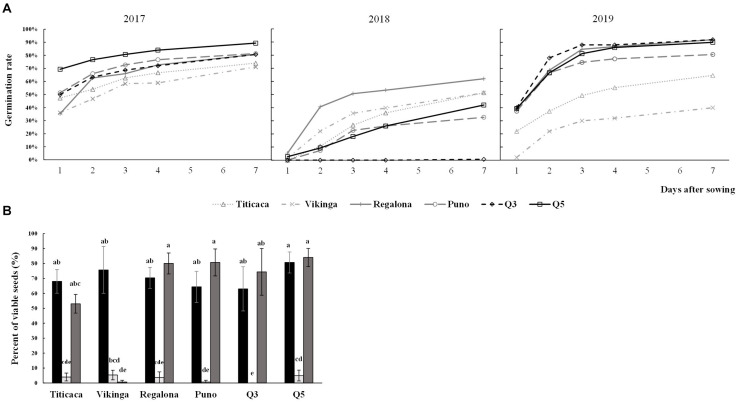
FIGURE 3.
Germination rates and seed viability. (A) Germination rates. Evolving germination rate is shown over the 7 first days after sowing seeds harvested in three consecutive years. (B) Seeds viability was evaluated using the tetrazolium method. Black bars, light gray bars, and dark gray bars indicate 2017 seeds, 2018 seeds, and 2019 seeds, respectively. A Welch’s ANOVA test followed by a Games-Howell post-hoc test was used to compare the data of germination rate at seven days after sowing, and a Krustal-Wallis test by ranks was performed for viability rate. Bars that do not share letters are significantly different.

