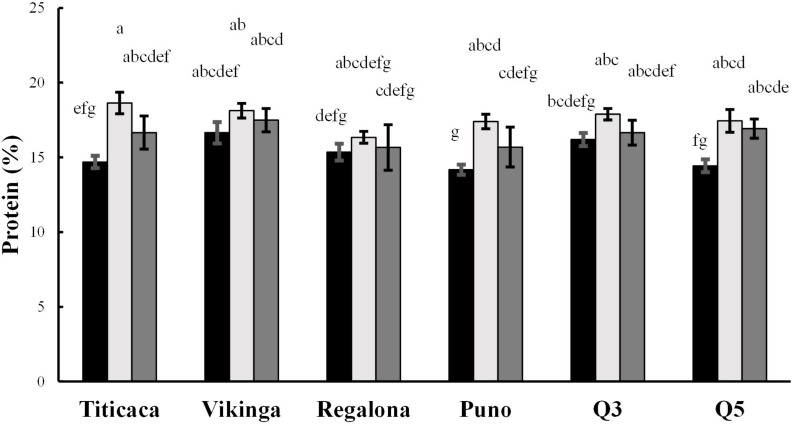
FIGURE 5.
Protein contents. Protein content presented as percentage of protein per seed dry weight. Black bars represent 2017 values, light gray bars show 2018 values, and 2019 values are represented by dark gray bars. Bars that do not share the same letters show statistically significant differences, following the ANOVA test and post-hoc test Tukey.

