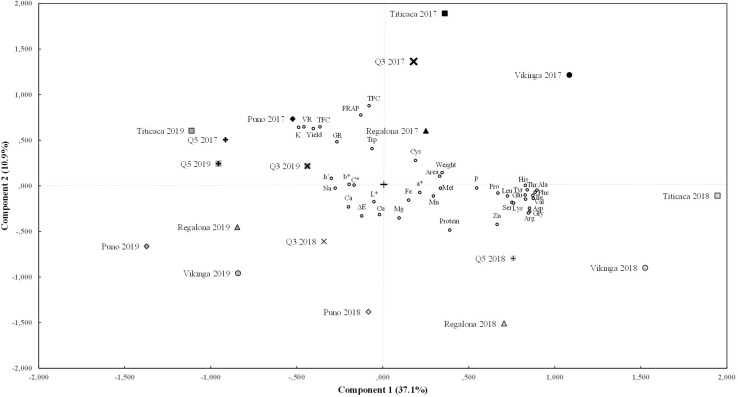
FIGURE 7.
Principal components analysis. Biplot of main components 1 and 2 for the cultivars sown in each year of the experiment and for the variables tested. Component 1 (X axis) is contributed mainly by seed viability rate (VR) and yield, amino acid content (except methionine, cysteine, and tryptophan), P, K, and Zn contents. Component 2 (Y axis) includes yield, viability and germination rate (GR), FRAP value, and protein, tryptophan, polyphenols (TPC), flavonoids (TFC), K, and Zn contents.

