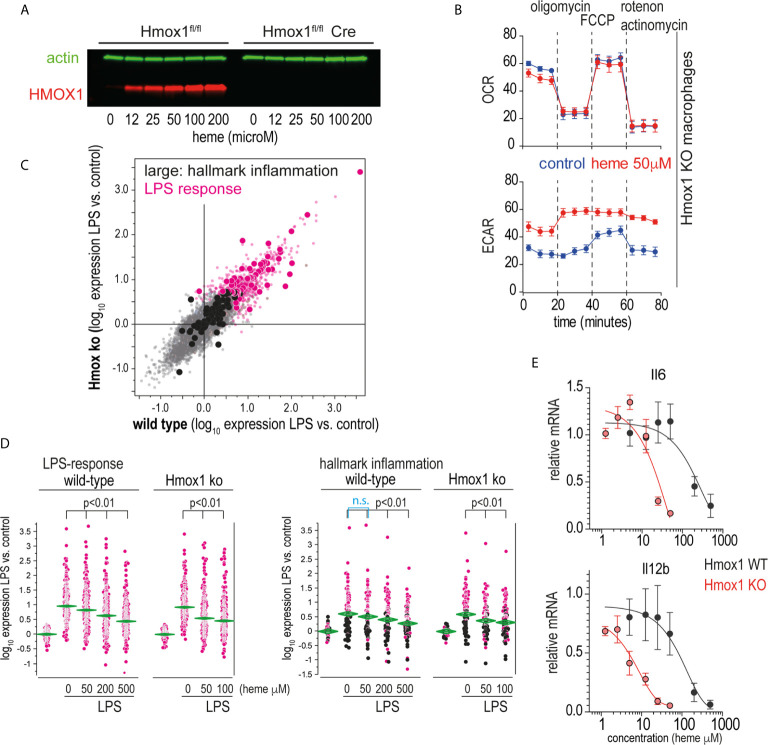
Figure 6.
Heme suppresses inflammation independently of its metabolites. (A) Western blot of HMOX1 in BMDMs from Hmox1fl/f UBC Cre-ERT2 (knockout) and Hmox1fl/fl (wild-type) mice after exposure to heme-albumin concentrations ranging from 0 to 200 µM for 4 h and LPS treatment for an additional 4 h. Beta-actin was used as a loading control. No HMOX1 expression is visible in the knockout macrophages. (B) Oxygen consumption rate (OCR) and extracellular acidification rate (ECAR) of heme-albumin (50 μM)- and albumin (control)-exposed Hmox1 knockout and wild-type BMDMs were measured using a Seahorse XFe24 extracellular flux analyzer. Measurements (n = 3) were recorded according to the standard protocol at baseline, after addition of oligomycin (an inhibitor of ATP synthase), after addition of carbonyl cyanide-4 (trifluoromethoxy) phenylhydrazone (FCCP) (an uncoupling agent, which allows to measure maximum mitochondrial oxygen consumption), and after addition of combined actinomycin A and rotenone (which shuts down mitochondrial respiration). (C) Correlation plot of mean mRNA expression changes in wild-type (Hmox1fl/fl) and Hmox1-knockout (Hmox1fl/fl UBC Cre-ERT2) BMDMs that were treated with LPS for 4 h (n = 4 experiments). All genes that were significantly upregulated by LPS are shown in pink (= LPS response). All the genes that define the hallmark “inflammation” gene set in the Molecular Signature Database are depicted with enlarged dots (black and pink). (D) Selective presentation of relative expression data for the transcripts defining the “LPS response” and “inflammation” classes across macrophages treated with LPS with/without heme. Statistical analyses of the average expression data were performed by ANOVA with Tukey’s post hoc test for multiple comparisons. The data demonstrate a dose-dependent attenuation of the expression of LPS-induced genes with increasing heme-albumin concentrations, and this effect was more pronounced in the absence of Hmox1 expression. (E) Relative expression of LPS-induced Il6 and Il12b mRNA in BMDMs from Hmox1fl/fl UBC Cre-ERT2 mice (knockout, red) and Hmox1fl/fl mice (wild-type, black) in response to increasing heme-albumin concentrations. The cells were treated with heme-albumin for 4 h before LPS stimulation. An expression level of 1.0 indicates the mean cytokine mRNA expression in LPS-treated cells in the absence of heme-albumin. The data show the mean ± SD of six biological replicates measured in parallel. n.s., not significant.

