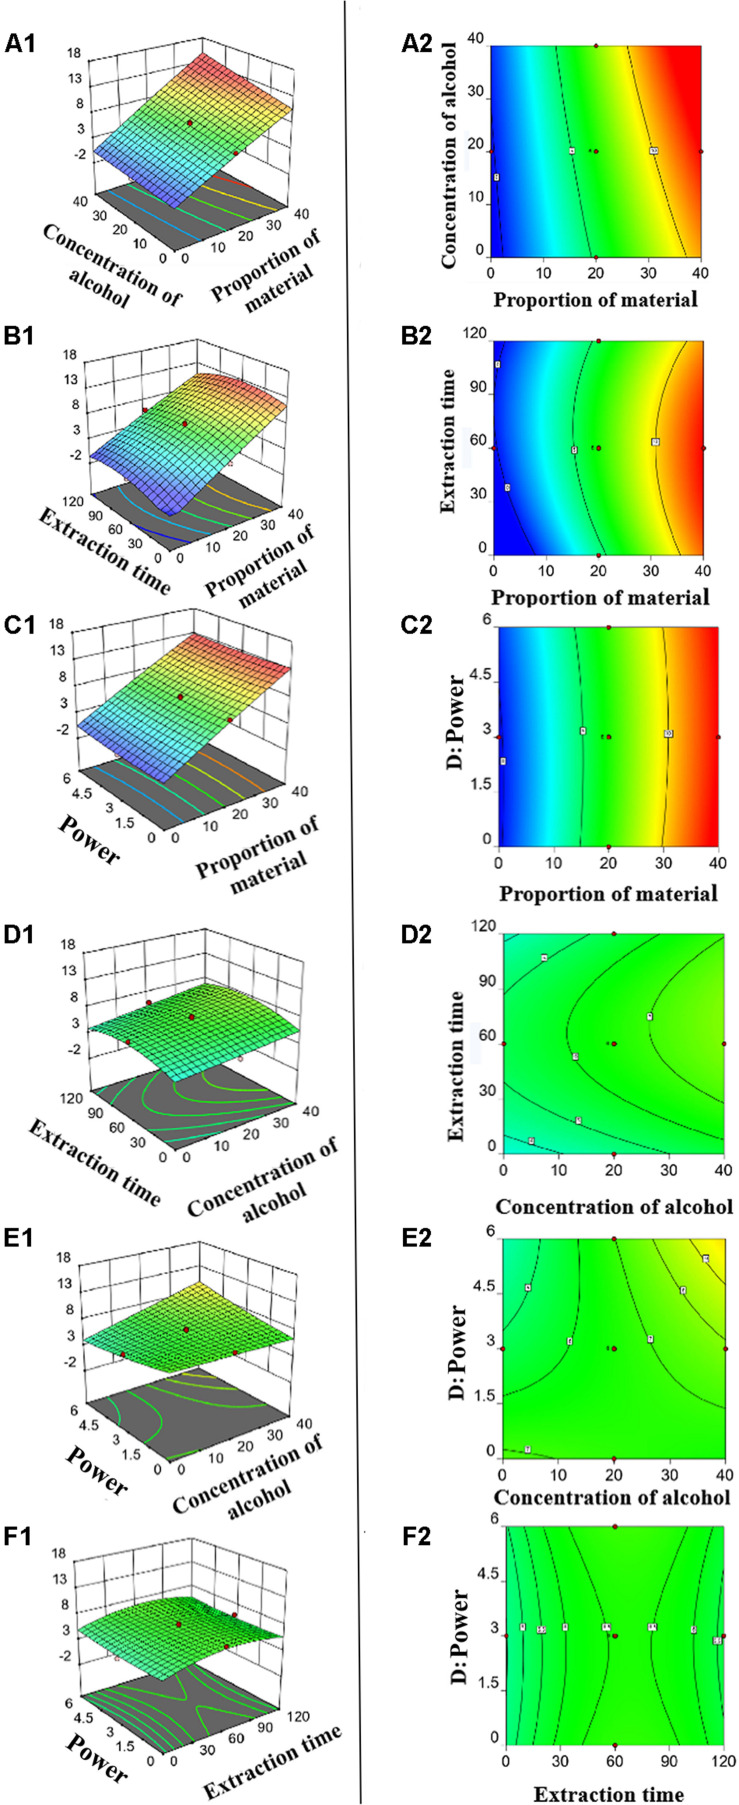
FIGURE 2.
Three-dimensional response plots (A1–F1) and contour plots (A2–F2) for optimized process parameters. (A1,A2) Proportion of material versus concentration of alcohol. (B1,B2) Proportion of material versus time. (C1,C2) Proportion of material versus power. (D1,D2) Concentration of alcohol versus time. (E1,E2) concentration of alcohol versus power. (F1,F2) time versus power.

