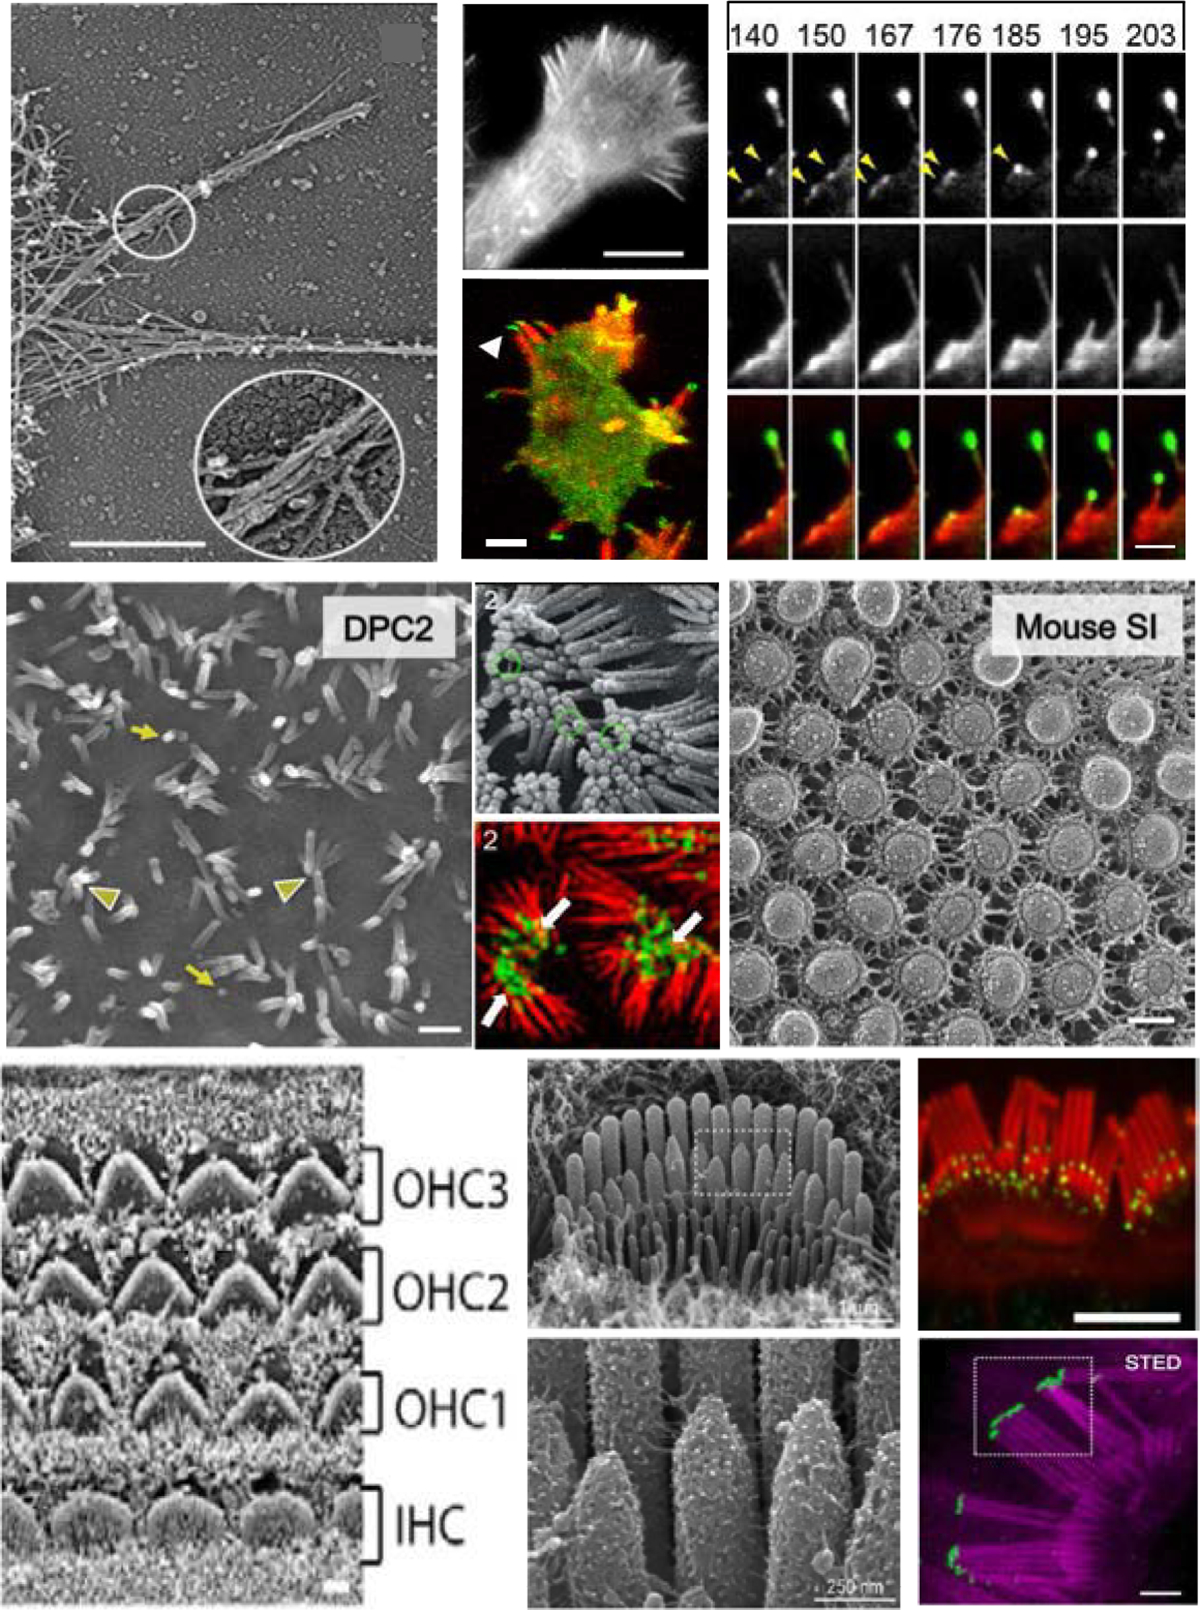
Figure 1. Features of filopodia, microvilli and stereocilia.

(A) Platinum replica micrograph of a filopodium extending from the lamella of a BG2 cell, scale = 1μm. (B) Filopodia emerging from the lamella of a BG2 fly neural cell, scale = 1μm. (C) Dictyostelium amoeba expressing GFP-DdMYO7 stained with phalloidin, scale = 5 μm. (D) Time course (in sec) of HeLa cell expressing EGFP-MYO10 (top) and mCherry-actin (middle) extending a filopodium, showing punctae assembling on the membrane that gives rise to a new filopodium, scale = 2 μm. (E) Scanning EM of the apical surface of differentiating Caco2BBE cells 2 days post confluency (DPC) showing microvilli buds (yellow arrows) and longer microvilli clustered at their tips (arrowheads), scale = 500 nm. (F) SEM at 8 DPC showing clustering of microvilli tips and the links between them (green circles), scale = each side is 50 μm. (G) Structured illumination microscopy of CACO-2BBE cells expressing EGFP-MYO7B (green) stained for F-actin (red). Distal tip enrichment is indicated by arrowheads, scale = each side is 50 μm. (H) Freeze-etch EM of apical surface of the mouse small intestine showing the organization of linked microvilli, scale = 100 nm. (I) SEM of the auditory epithelium from a P8 mouse showing the organization of the outer and inner hair cells (OHC, IHC), scale = 1 μm. (J) SEM of IHC stereocilia at P4, boxed region at top is shown below. Note the inter-stereocilia links. (K) IHC stained for MYO15-L (green - tips of row 2 and 3) and actin (red), scale = 500 nm. (L) STED microscopy showing actin (purple) and GPSM2 (green) localized to the tip of row 1 stereocilia, scale = 2 μm.
(A,B) 154 (C) 6 (D) 33 (E, H) 70 (F, G) 71 (I) (J,K)146 (L) 149.
