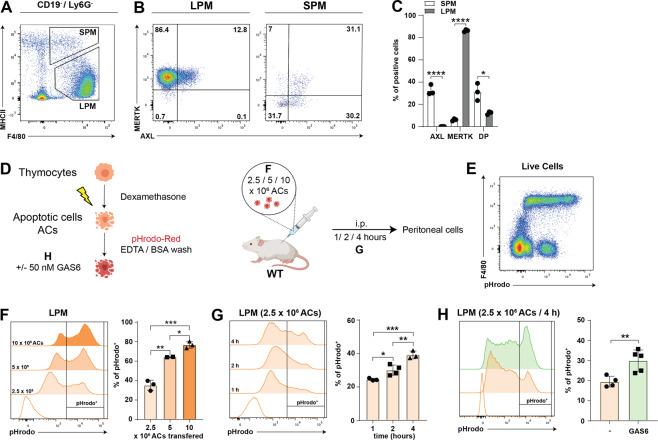
Fig. 3. GAS6 augments homeostatic efferocytosis in murine peritoneal macrophages.
A Gating strategy to identify murine large (LPM) and small (SPM) peritoneal macrophages. Cells were gated as CD19−, Ly6G− live cells. B Representative flow cytometric analysis for expression of AXL and MERTK on LPM and SPM. C Frequency of AXL or MERTK single and double positive LPM and SPM. Bar graphs show mean with SD and individual samples. D Experimental set-up to study efferocytosis in the murine peritoneum. Apoptotic cells (AC) were generated by treating murine thymocytes with dexamethasone. Afterwards, cells were labeled with pHrodo-Red and washed with EDTA/BSA and PBS. To set-up the model, initially different numbers of ACs were injected intraperitoneally. Peritoneal exudate cells (PECs) were analyzed at different time points by flow cytometry. Created with BioRender.com E Representative flow cytometric analysis of PECs for expression of F4/80 and pHrodo-Red signal. F Representative histograms for pHrodo-Red upon injection of different numbers of ACs and PECs isolated after 4 h (Gated on CD19−, F4/80+ live cells). Statistical analysis of pHrodo+ cells. Bar graphs show mean with SD and individual samples. G Representative histograms for pHrodo-Red upon injection of 2.5 × 10⁶ ACs and PECs were isolated at indicated time points (Gated on CD19−, Ly6G−, and F4/80+ live cells). Statistical analysis of pHrodo+ cells. Bar graphs show mean with SD and individual samples. H Representative histograms for pHrodo-Red upon injection of 2.5 × 10⁶ ACs with or without 50 nM GAS6. PECs were isolated at indicated time points (Gated on CD19−, Ly6G−, and F4/80+ live cells). Bar graphs show mean with SD and individual samples. Data were representative of two individual experiments (n = 3–5).

