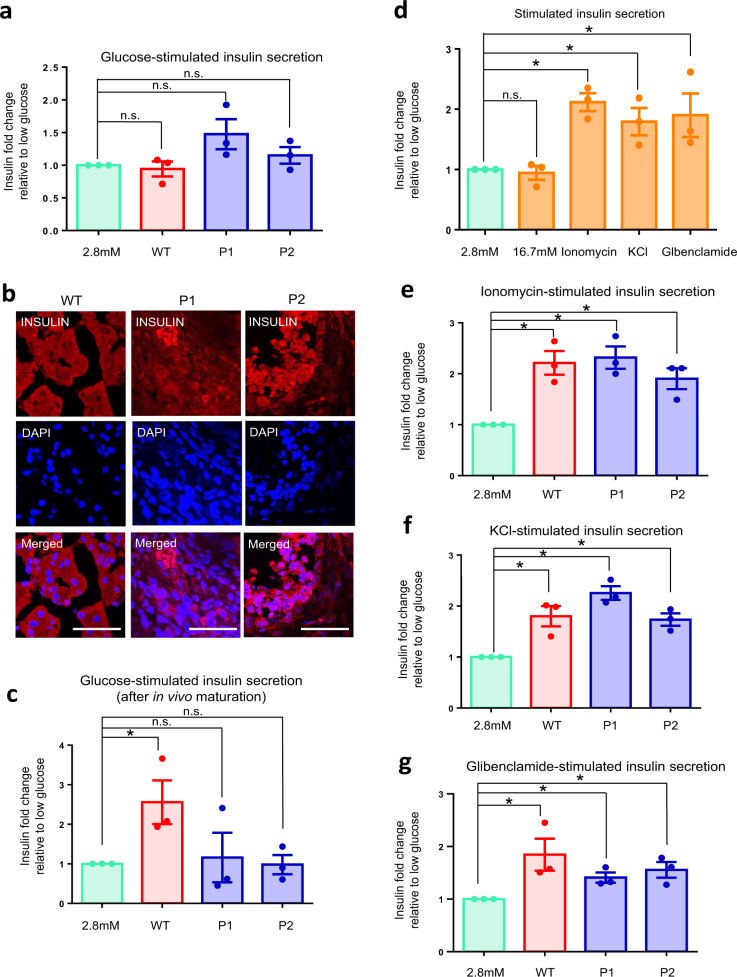
Fig. 6. MODY3-hiPSC-derived mutant β-like cells did not exhibit defects in calcium signaling nor potassium channels.
a Glucose-stimulated insulin secretion of WT (red) and patient-specific (blue) hPSC-derived β-like cells in vitro. n = 3 independent experiments. b Immunohistochemistry stain for INS (red) and nuclear stain using DAPI (blue) in β-like cells after in vivo maturation in mouse kidney capsule for 23 weeks. n = 3 independent experiments. (scale bar: 50 μm). c Glucose-stimulated insulin secretion of WT (red) and patient-specific hPSC-derived β-like (blue) cells after in vivo maturation in mouse kidney capsule for 23 weeks. n = 3 independent experiments; p = 0.0478 (WT). d Insulin secretion of WT β-like cells after stimulation with 2.8 mM glucose (green), 16.7 mM glucose, 10 μM ionomycin, 30 mM KCl or 100 μM glibenclamide. n = 3 independent experiments; p = 0.0017 (ionomycin), 0.0245 (KCl), 0.0672 (glibenclamide). e Ionomycin-stimulated insulin secretion of WT (red) and patient-specific (blue) hPSC-derived β-like cells. n = 3 independent experiments; p = 0.0064 (WT), 0.0038 (P1), 0.0117 (P2). or f KCl-stimulated insulin secretion of WT (red) and patient-specific (blue) hPSC-derived β-like cells. n = 3 independent experiments; p = 0.0158 (WT), 0.0007 (P1), 0.0037 (P2). g Glibenclamide-stimulated insulin secretion of WT (red) and patient-specific (blue) hPSC-derived β-like cells. n = 3 independent experiments; p = 0.0496 (WT), 0.0136 (P1), 0.0203 (P2). All insulin fold changes are normalized to insulin amounts secreted at 2.8 mM glucose (green) under each condition. WT wild-type, P1 patient 1, P2 patient 2. hPSC human pluripotent stem cells. For all statistical analysis: Error bars represent standard error of mean (SEM). Unpaired one-tailed Student’s t-test was performed. Aterisk indicates P-value < 0.05. “See also Fig. S8.” Source data are provided as a Source data file.

