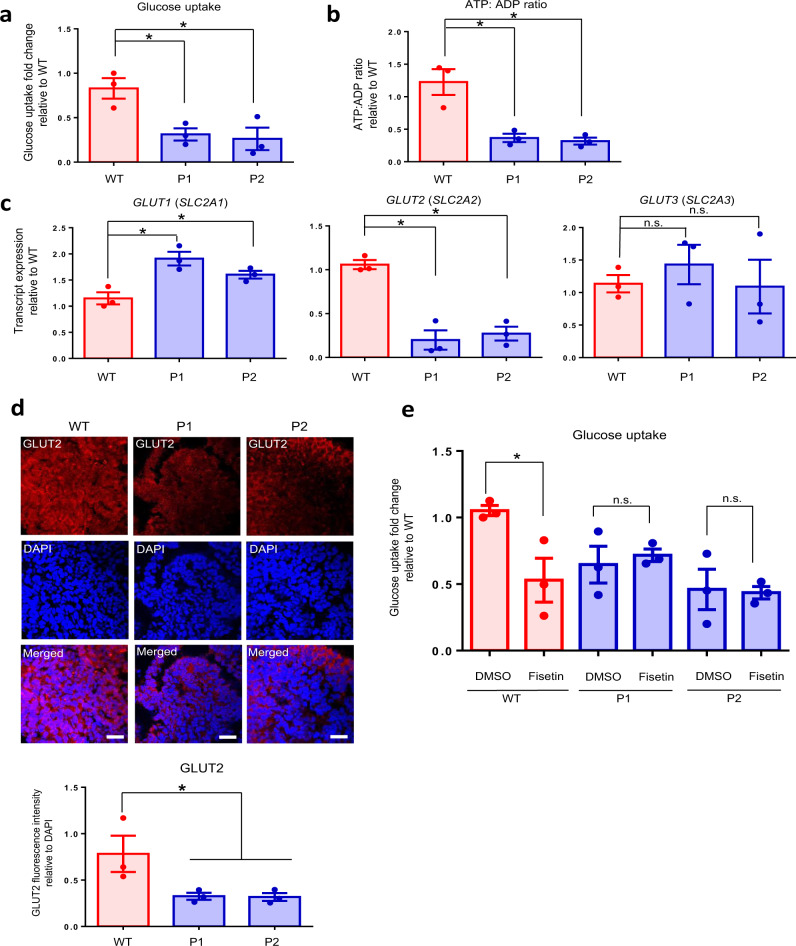
Fig. 7. Decreased GLUT2 expression, glucose uptake and ATP production in MODY3 mutant β-like cells.
a Glucose uptake in WT (red) and patient-specific (blue) hPSC-derived β-like cells. n = 3 independent experiments; p = 0.0182 (P1), 0.0294 (P2). b ATP: ADP ratio in WT (red) and patient-specific (blue) hPSC-derived β-like cells. n = 3 independent experiments; p = 0.0144 (P1), 0.0113 (P2). c RT-qPCR analysis of GLUT1, GLUT2 and GLUT3 transcripts in WT (red) and mutant (blue) hPSC-derived endocrine progenitors. n = 3 independent experiments; P-value for GLUT1 = 0.0125 (P1), 0.0373 (P2); GLUT1 = 0.0068 (P1), 0.0021 (P2). d Immunohistochemistry stain of GLUT2 (red) and DAPI (blue) in WT and mutant differentiated day 20 endocrine progenitors. n = 3 independent experiments. (scale bar:100 μm). e Glucose uptake in WT (red) and patient-specific (blue) hPSC-derived β-like cells in the presence of dimethyl sulfoxide (DMSO) or 60 μM GLUT2 inhibitor, fisetin. Glucose uptake fold changes are normalized to glucose uptake amount in the presence of DMSO in WT. n = 3 independent experiments; p = 0.0362 (WT). WT wild-type, P1 patient 1, P2 patient 2. hPSC human pluripotent stem cells. For all statistical analysis: Error bars represent standard error of mean (SEM). Unpaired one-tailed Student’s t-test was performed. Asterisk indicates P-value < 0.05. n.s. non-significant. “See also Figs. S9 and S10.” Source data are provided as a Source data file.

