Figure 5.

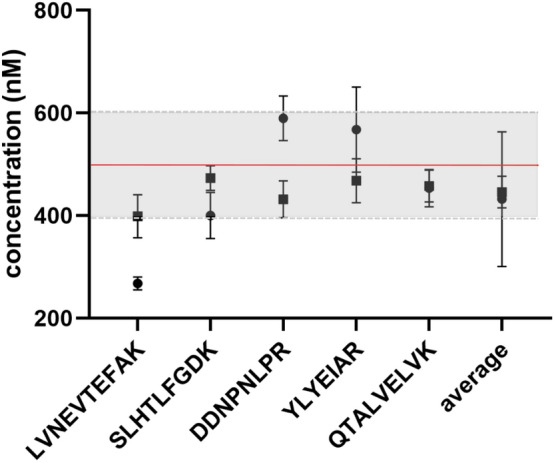
The comparison of the quantitative performance of SIL-ExC3N3 (filled circle) and SIL-HSA (filled square). HSA concentration determined by reference methods (500 nM) indicated as a red line; the grey area represents 20% tolerance.

The comparison of the quantitative performance of SIL-ExC3N3 (filled circle) and SIL-HSA (filled square). HSA concentration determined by reference methods (500 nM) indicated as a red line; the grey area represents 20% tolerance.