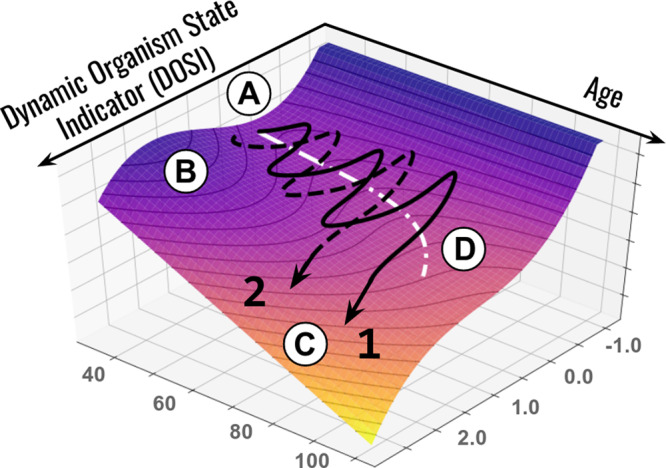
Fig. 4. Schematic representation of loss of resilience along aging trajectories.

Representative aging trajectories are superimposed over the potential energy landscape (vertical axis) representing regulatory constraints. The stability basin (A) is separated from the unstable region (C) by the potential energy barrier (B). Aging leads to a gradual decrease in the activation energy and barrier curvature and an exponential increase in the probability of barrier crossing. The stochastic activation into a dynamically unstable (frail) state is associated with acquisition of multiple morbidities and certain death of an organism. The white dotted line (D) represents the trajectory of the attraction basin minimum. Examples 1 (black solid line) and 2 (black dashed line) represent individual life-long stochastic DOSI trajectories that differ with respect to the age of first chronic disease diagnosis.
