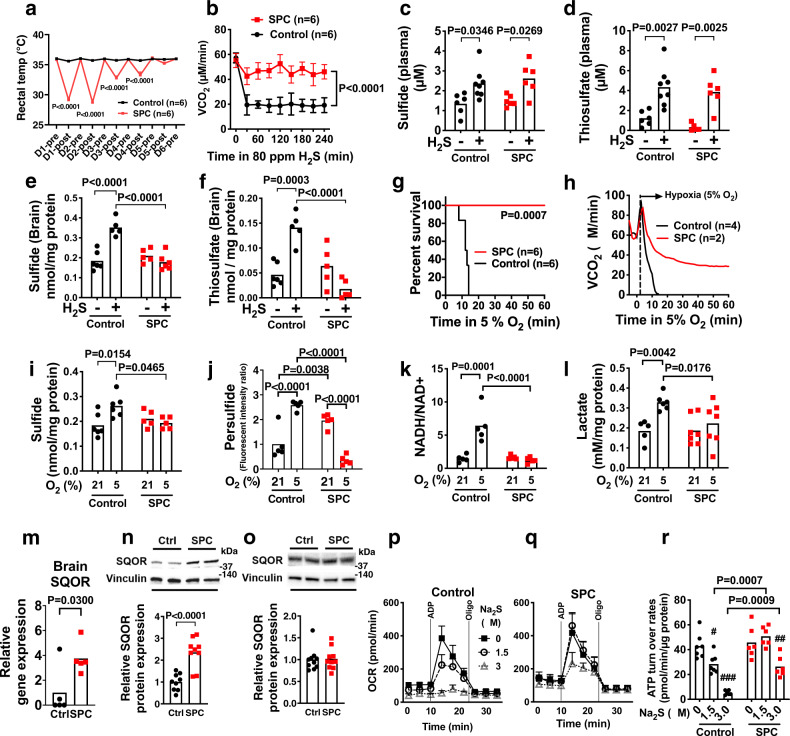
Fig. 1. Effects of sulfide pre-conditioning on sulfide metabolism and hypoxia tolerance in mice.
a Body temperature of control and sulfide pre-conditioned (SPC) mice. “Pre” and “post” time points depict mice before and after breathing air (control) or H2S at 80 ppm for 4 h, respectively, from day 1 (D1) to day 6 (D6). b Whole-body CO2 production rate (VCO2) of SPC and control mice during H2S breathing on the 6th day after starting SPC or control air breathing. Concentration of c sulfide (from left to right, n = 6, 8, 6, 6) and d thiosulfate (n = 6, 8, 6, 6) in plasma and concentrations of e sulfide (n = 6 each) and f thiosulfate (n = 6 each) in the brain of SPC and control mice during H2S or air breathing on the 6th day. g Survival rate and h VCO2 of mice breathing 5% O2 on the 6th day in control or SPC mice. Brain levels of i sulfide (n = 6, 6, 5, 5), j persulfide (n = 5 each), k NADH/NAD+ ratio (n = 5 each), and l lactate levels (n = 5, 6, 7, 7) in control and SPC mice breathing at FiO2 = 21% or 5% on the 6th day. m Relative mRNA levels of SQOR in the brain of SPC and control mice (normalized as control = 1). n = 5 each. SQOR protein levels in n the brain tissue extracts (n = 9 each) and in o the heart (n = 10 each) from control and SPC mice. Oxygen consumption rate (OCR) of isolated brain mitochondria from p control (n = 7) and q SPC (n = 6) mice with or without incubation with sulfide (Na2S, 0, 1.5, 3.0 µM) and r calculated ATP turnover rates (n = 7, 7, 7, 6, 6, 6). Data are presented as mean ± SEM or mean and individual values. #P < 0.05, ##P < 0.01, ###P < 0.001 vs Na2S at 0 µM of respective group. Two-way ANOVA followed by Sidak’s or Tukey’s correction for post-hoc comparisons were performed for a–f, i–l, and r. Survival rates were estimated using the Kaplan–Meier method and a log-rank test was used to compare the survival curves between groups in g. A two-tailed unpaired t-test was performed for m–o.

