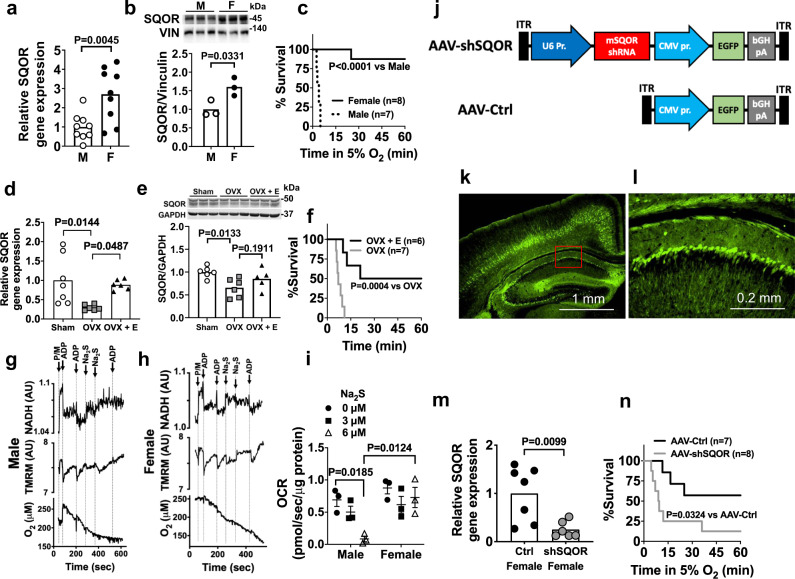
Fig. 2. Sexual dimorphism of SQOR expression in the brain.
a Relative SQOR mRNA levels (n = 9 each) and b protein levels (n = 3 each) in male and female CD-1 mice. Vin, vinculin. c Survival curve of male and female CD-1 mice breathing 5% oxygen. Effects of ovariectomy (OVX) and 17 beta-estradial (E) replacement on d SQOR mRNA levels (n = 7, 6, 6) and e protein levels (n = 6, 5, 5) in the brain and f survival rate in hypoxia (5% O2) in female CD-1 mice. Impact of sulfide (Na2S) on ADP-induced changes in NADH levels, mitochondrial membrane potential (TMRM, tetramethylrhodamine methylester), and oxygen consumption rates (OCR) in suspensions of isolated brain mitochondria from g male and h female WT mice. P/M, pyruvate/malate. Representative traces of three independent experiments in each genotype. i Summary of OCR values in response to ADP before and after administration of sulfide (Na2S, 0, 3, 6 µM) in experiments represented in g and h. n = 3 at each Na2S dose. j Structure of AAV containing shRNA against mouse SQOR (AAV-shSQOR) under a U6 promoter for RNA polymerase III and control AAV (AAV-Ctrl). ITR, inverted terminal repeat, EGFP, enhanced green fluorescent protein, CMV, cytomegalovirus, bGH, bovine growth hormone. k, l Representative immunofluorescence images of the brain sections of CD-1 mice stained with an anti-GFP antibody 8 weeks after injection of AAV-Ctrl into ICV. Image in l shows a blow-up of a part of the image in k enclosed in a red box. n = 2 biologically independent experiments. m Relative SQOR mRNA levels in the brains of female CD-1 mice transfected with AAV-Ctrl or AAV-shSQOR (n = 7, 6). n Survival curve of adult female CD-1 mice infected with AAV-Ctrl or AAV-shSQOR breathing 5% oxygen. Data are presented as mean ± SEM or mean and individual values. A two-tailed unpaired t-test was performed for a, b, and m. Survival rates were estimated using the Kaplan–Meier method and a log-rank test was used to compare the survival curves between groups in c, f, and n. One-way or two-way ANOVA followed by Dunnett’s or Tukey’s correction for post-hoc comparisons were performed for d, e, and i.

