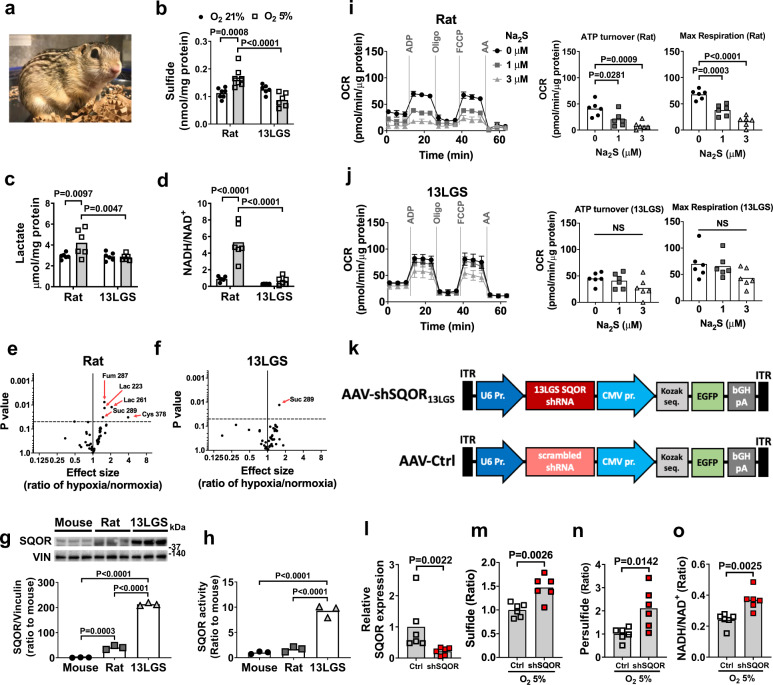
Fig. 4. Hypoxia tolerance and enhanced sulfide catabolism in 13-lined ground squirrels.
a 13 lined ground squirrel. Levels of b sulfide (n = 7, 7, 6, 6), c lactate (n = 6 each), and d NADH/NAD+ ratio (n = 6 each) in brains of rats and 13LG squirrels (13 LGS) breathing 21% or 5% oxygen for 5 min under isoflurane anesthesia. Volcano plots showing the changes in whole-brain metabolite profiles in response to breathing 5% oxygen in e rats and f 13LG squirrels. Lac, lactate; Cys, cysteine; Fum, fumarate; Suc, succinate. g Immunoblots and protein expression levels of SQOR in forebrains of mouse, rat, and 13LG squirrel (N = 3 each). h SQOR enzyme activity in forebrains in mouse, rat, and 13LG squirrel (N = 6 each). ATP turnover rate and maximal respiratory rate of isolated brain mitochondria measured as oxygen consumption rate (OCR) in i rats and j 13LG squirrels incubated with 0, 1, or 3 μM of Na2S (n = 6 each). k Structure of AAV containing shRNA against 13LG squirrel SQOR (AAV-shSQOR13LGS) under a U6 promoter for RNA polymerase III and control AAV (AAV-Ctrl) containing scrambled shRNA. l Relative SQOR mRNA levels in the brain of 13LG squirrels infected with AAV-Ctrl (Control) or AAV-shSQOR13LGS (shSQOR). Relative levels of m sulfide and n persulfide and o the ratio of NADH/NAD+ in the brains of Control or shSQOR-infected 13LG squirrels breathing 5% oxygen under anesthesia. n = 6 each. Data are presented as mean ± SEM or mean and individual values. Two-way or one-way ANOVA followed by Sidak’s correction for post-hoc comparisons were performed for b–d and g–j. Volcano plots were created using values in Supplementary Table S1 and S2. A two-tailed unpaired t-test was performed for l, n, and o. Mann–Whitney U test was performed for m.

