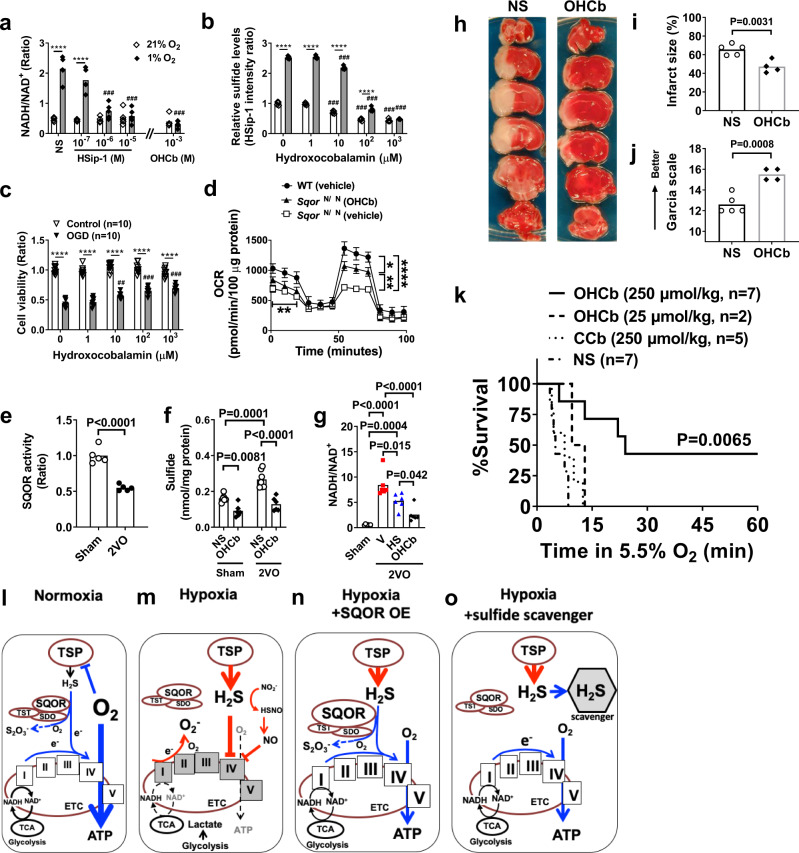
Fig. 7. Effects of sulfide scavenger.
a NADH/NAD+ ratio in SH-SY5Y cell lysates 3 h after incubation in hypoxia or normoxia with varying doses of HSip-1 or hydroxocobalamin (OHCb). n = 5 each. ***P < 0.001 vs normal saline (NS) at nomoxia. ###P < 0.001 vs NS at hypoxia. b Relative sulfide levels in SH-SY5Y incubated in normoxia or hypoxia in the presence of varying concentrations of OHCb. n = 5 each. c Cell viability of SH-SY5Y subjected to oxygen and glucose deprivation (OGD) in the presence of varying levels of OHCb, assessed by crystal violet assay. n = 10 each. ***P < 0.001, ##, ###P < 0.1, 0.001 vs OHCb 0 μM. d Oxygen consumption rate (OCR) was measured in isolated brain mitochondria from SqorΔN/ΔN mice with or without OHCb and compared to isolated mitochondria of wild-type littermates treated with vehicle (n = 4 each). e SQOR activity (n = 5 each) and f sulfide levels (n = 6, 6, 7, 6) in the brains of mice subjected to sham operation or 2VO and treated with saline or OHCb. g NADH/NAD+ ratio in the brains of sham-operated mice or in mice 5 min after the start of 2VO treated with vehicle (V), HSip-1 (HS), or OHCb (n = 6 each). h Representative photographs of the TTC staining of coronal brain sections of male mice subjected to permanent MCAO and treated with normal saline (NS) or OHCb. i Brain infarct volume and j neurologic function in male mice after 2VO and reperfusion (n = 5, 4). k Survival curve of male CD-1 mice treated with OHCb, cyanocobalamin (CCb), or normal saline breathing 5.5% oxygen. Diagram illustrating working hypothesis on the role of SQOR and sulfide on mitochondrial energy production during l normoxia, m hypoxia, n hypoxia with SQOR expression, and o hypoxia with sulfide scavenger. TSP, transsulfuration pathway. TST, thiosulfate sulfurtransferase. ETHE1, ethylmalonic encephalopathy 1. TCA, tricarboxylic acid cycle, or Krebs cycle. Mitochondrial electron transport chain (ETC) complex are shown with roman numerals in boxes. Data are presented as mean and individual values. Two-way ANOVA followed by Tukey’s or Sidak’s correction for post-hoc comparisons were performed for a–d and f. Two-tailed unpaired t-test was performed for e, i, and j. One-way ANOVA followed by Tukey’s correction for post-hoc comparisons were performed for g. Survival rates were estimated using the Kaplan–Meier method and a log-rank test was used to compare the survival curves between groups in k.

