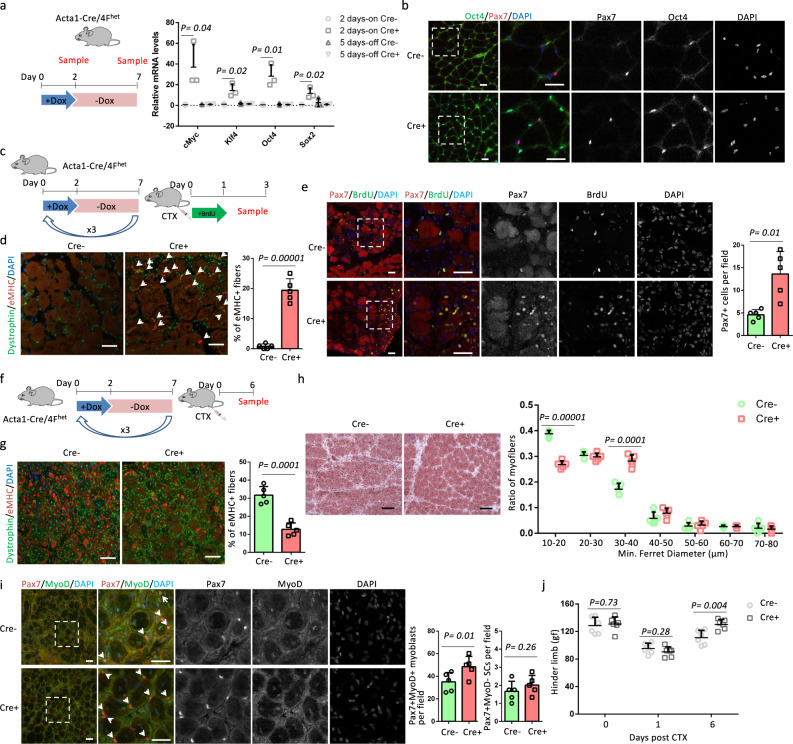
Fig. 2. Myofiber-specific OSKM induction accelerates muscle regeneration.
a Relative mRNA levels of OSKM in TA muscles after 2-days Dox treatment (2 days-on) and after 5-days Dox withdrawal (5 days-off). n = 3 Cre− mice for 2 days-on and 5 days-off. n = 3 Cre+ mice for 2 days-on and 4 Cre+ mice for 5 days-off. Error bars represent mean+SD. b Immunostaining of Oct4 and Pax7 in TA muscle sections. Scale bars = 50 µm. Similar results were repeated independently in four pairs of mice. In addition, similar results were repeated three times for each mouse. c, f Schematic representation of the experimental design. d, g Immunostaining of embryonic myosin heavy chain (eMHC) and Dystrophin in TA muscle sections, and the quantification of the percentage of immature myofibers that express eMHC. Error bars represent mean + SD of five biological independent samples. Arrows indicate eMHC+ myofibers in panel d. Scale bars = 50 µm. e Immunostaining of Pax7 and BrdU, and quantification of Pax7 in TA muscle sections. Error bars represent mean + SD of five mice. Representative regions are shown at higher magnification. Scale bars = 50 µm. h H&E staining of TA muscle sections and myofiber size distributions in TA muscle sections. Error bars represent mean + SD of five mice. Scale bars = 100 µm. i Immunostaining and quantification of Pax7 and MyoD in TA muscle sections. Representative regions are shown at higher magnification. Pax7+ cells are indicated by arrows. Scale bars = 50 µm. Error bars represent mean + SD of five mice. j Hinder limb grip strength at different time points after CTX injection. Error bars represent mean + SD of six mice. A two-sided unpaired Student’s t-test was performed.

