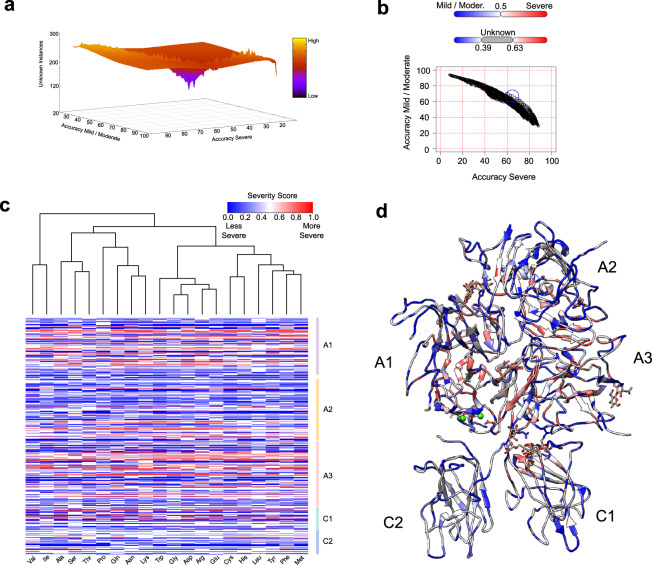
Fig. 3. Hema-Class refinement and predictions.
a The accuracy of the severe and the mild/moderate classes varies depending on the Severity Score cutoffs. Changing the Severity Score cutoffs effectively creates a “gray zone” where fewer instances are classified, but with higher accuracy. Depicted is the landscape created by varying the cutoff values. b Each dot is a combination of a minimum and maximum Severity Score cutoffs, and the blue circle depicts the values that enabled Hema-Class to achieve the best classification of FVIII point-mutations not seen during the training phase (~60% for both severe and mild/moderate classes). c Predicted Severity Score of all possible mutations of the FVIII amino acids in the FVIII structure (available in Supplementary Table 2). d FVIII structure colored by the Severity Score of each amino acid. Red indicates a higher probability of loss of function.

