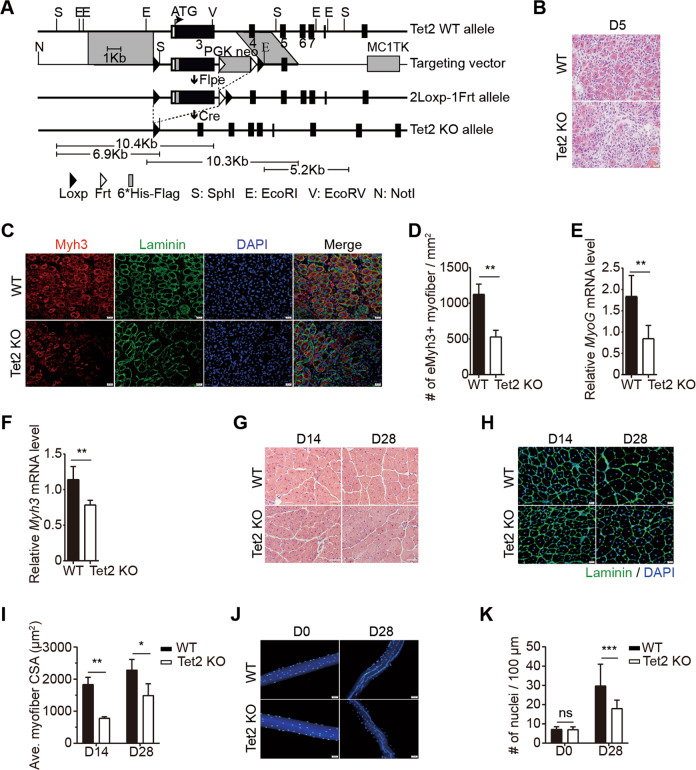
Fig. 1. Tet2 KO mice display muscle regeneration defects.
A The scheme of Tet2 KO strategy. B Representative images of H&E staining of TA muscles isolated from WT or Tet2 KO mice on day 5 after injury. Scale bars, 20 μm. C Immunofluorescence staining of Myh3 and Laminin of TA muscles isolated from WT or Tet2 KO mice on day 5 after injury. Scale bars, 20 μm. D Quantification of the number of Myh3+ myofiber per mm2 on day 5 after injury (n = 3). E Relative mRNA expression level of MyoG in TA muscles isolated from WT or Tet2 KO mice on day 3 after injury (n = 5). F Relative mRNA expression level of Myh3 on day 5 after injury (n = 5). G Representative images of H&E staining of TA muscles isolated from WT or Tet2 KO mice on day 14 or day 28 after injury. Scale bars, 50 μm. H Immunofluorescence staining of Laminin of TA muscles isolated from WT or Tet2 KO mice on day 14 or day 28 after injury. Scale bars, 20 µm. I Quantification of the cross-section area (CSA) from regenerated myofibers on day 14 and 28 after injury (n = 3). J Representative images of myonuclear staining of myofibers isolated from WT or Tet2 KO TA muscle before injury or on day 28 after injury. Scale bars, 50 µm. K Quantification of myonuclei number per 100 µm in single myofiber on day 28 after injury (n = 3). *p < 0.05, **p < 0.01, ***p < 0.001.

