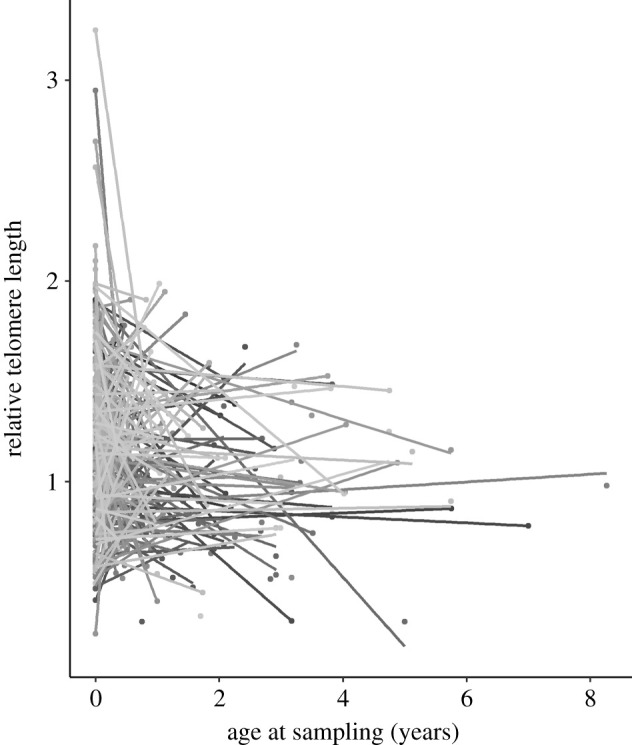
Figure 1.

Plot of 250 individual linear trajectories (shaded differently) of relative telomere length sampled from nestling house sparrows at 10 days post-hatch (age = 0 years) and again one to three times later in life, with age at sampling indicated in years. Mixed model analysis (see text) revealed significant intercept and slope variation.
