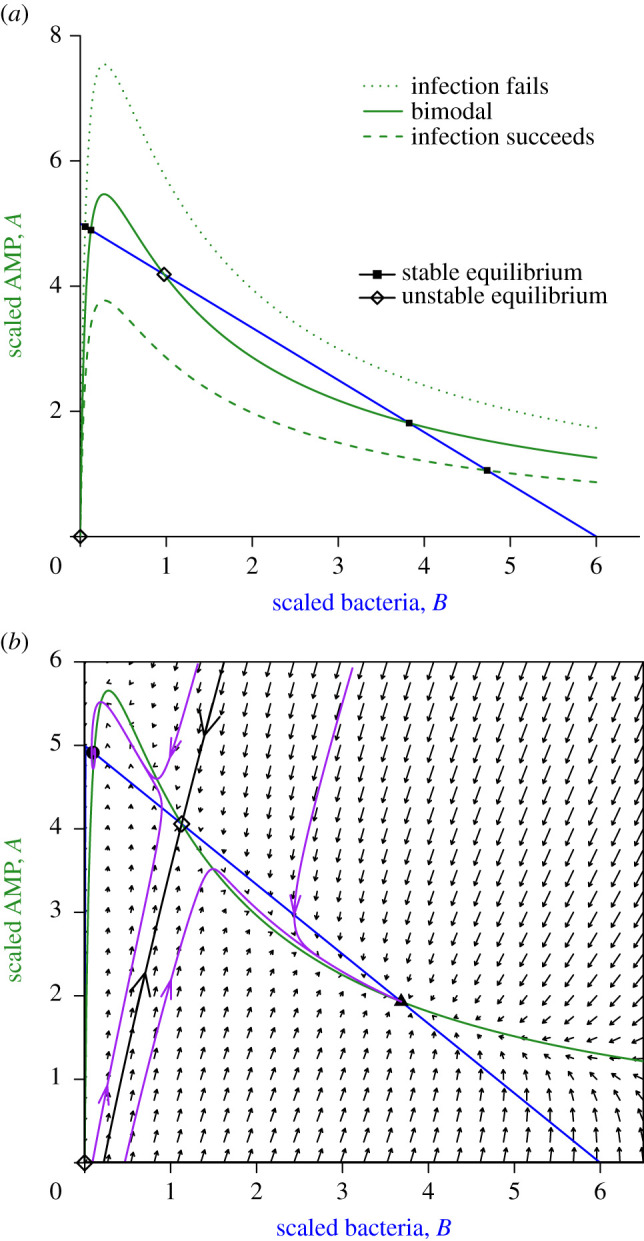
Figure 2.

Phase-plane diagrams of the conceptual model. (a) Possible nullcline configurations. The blue line is the B nullcline, the three green curves are the A nullcline for three different values of QA (4, 5.8 and 8) from lowest to highest, with K = 6, δA = 0.05, c = 0.2, m = 0.45. Equilibria (where nullclines intersect) can be stable (solid square) or unstable (open diamond). (b) Phase portrait in the bistable case. Black curve is the stable manifold of the interior unstable equilibrium, which is a saddle. Solution trajectories (purple curves) converge to one or the other stable equilibia, depending on the location of their starting point, approaching along the unstable manifold of the saddle (not drawn). Figures were created by script files BAnullclinesPlot.R, BAModel.R. (Online version in colour.)
