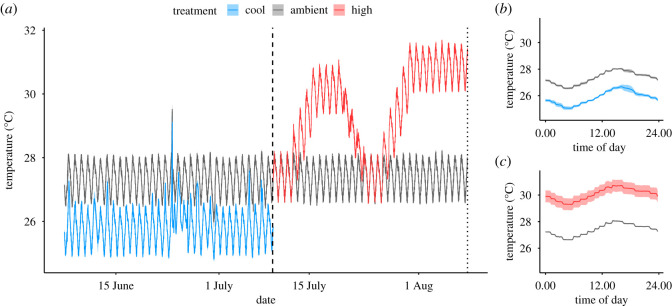
Figure 1.
Temperature treatment profiles. (a) Mean temperature (°C) (blue = cool; grey = ambient; red = high) profile over rearing treatment period and thermal stress period in 12 tanks (n = 6 per treatment). Dashed line indicates the end of rearing treatment period and the start of thermal stress period. Dotted line indicates the end of the thermal stress period. (b) Mean temperatures (°C) recorded every 15 min over 24 h cycle during rearing period. (c) Mean temperatures (°C) recorded every 15 min over 24 h cycle during thermal stress period. In all plots, shading indicates standard error of mean.

