. 2020 Jan 14;11(8):2161–2168. doi: 10.1039/c9sc05248h

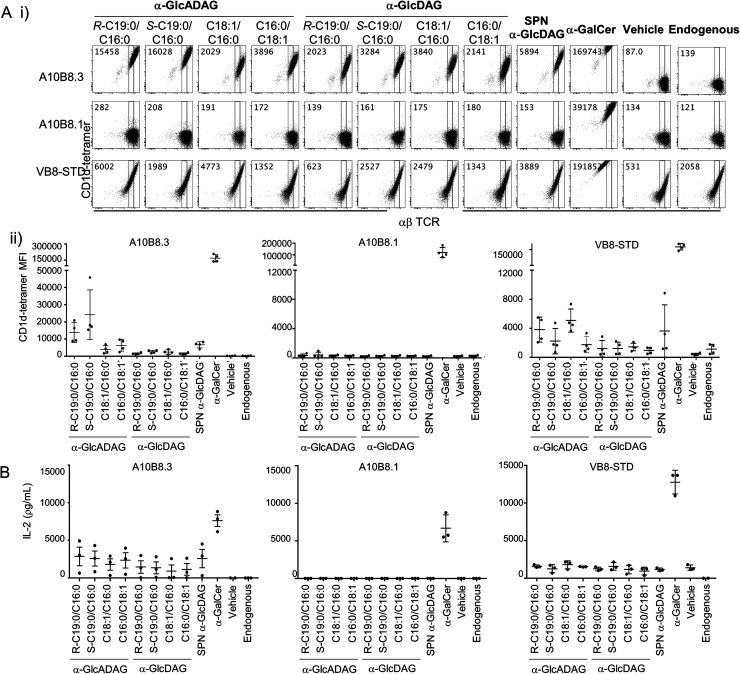
Fig. 3. Reactivity of CD1d-restricted TCR+ cell clones to glycolipids. (A) (i) Representative plots of flow cytometry of type I (VB8-STD) and atypical (A10B8.1 and A10B8.3) TCR-transduced BW58 cells labelled with CD1d tetramers loaded with lipids. Numbers in the top left corners of representative plots indicate mean fluorescence intensity (MFI) for each tetramer. (ii) Graphs display MFI for CD1d-tetramers loaded with the indicated lipids (x-axes) for each cell line. Data are representative of 4 independent experiments. One of the 4 datapoints for the CD1d-α-GalCer, -Endo and -α-GlcADAG controls for A10B8.1, 8.3 and VB8-STD TCRs were part of a larger experiment with additional TCRs, previously published in ref. 6 (B) TCR+ cell lines were co-cultured overnight in the presence of plate-bound CD1d–glycolipid–Ag complex (pre-loaded at 10 μg mL−1). After 16 hours, the supernatants were collected and the presence of IL-2 measured by cytometric bead array. Graphs show IL-2 detected in the supernatant. Data is derived from 3 independent experiments.

Fig. 3