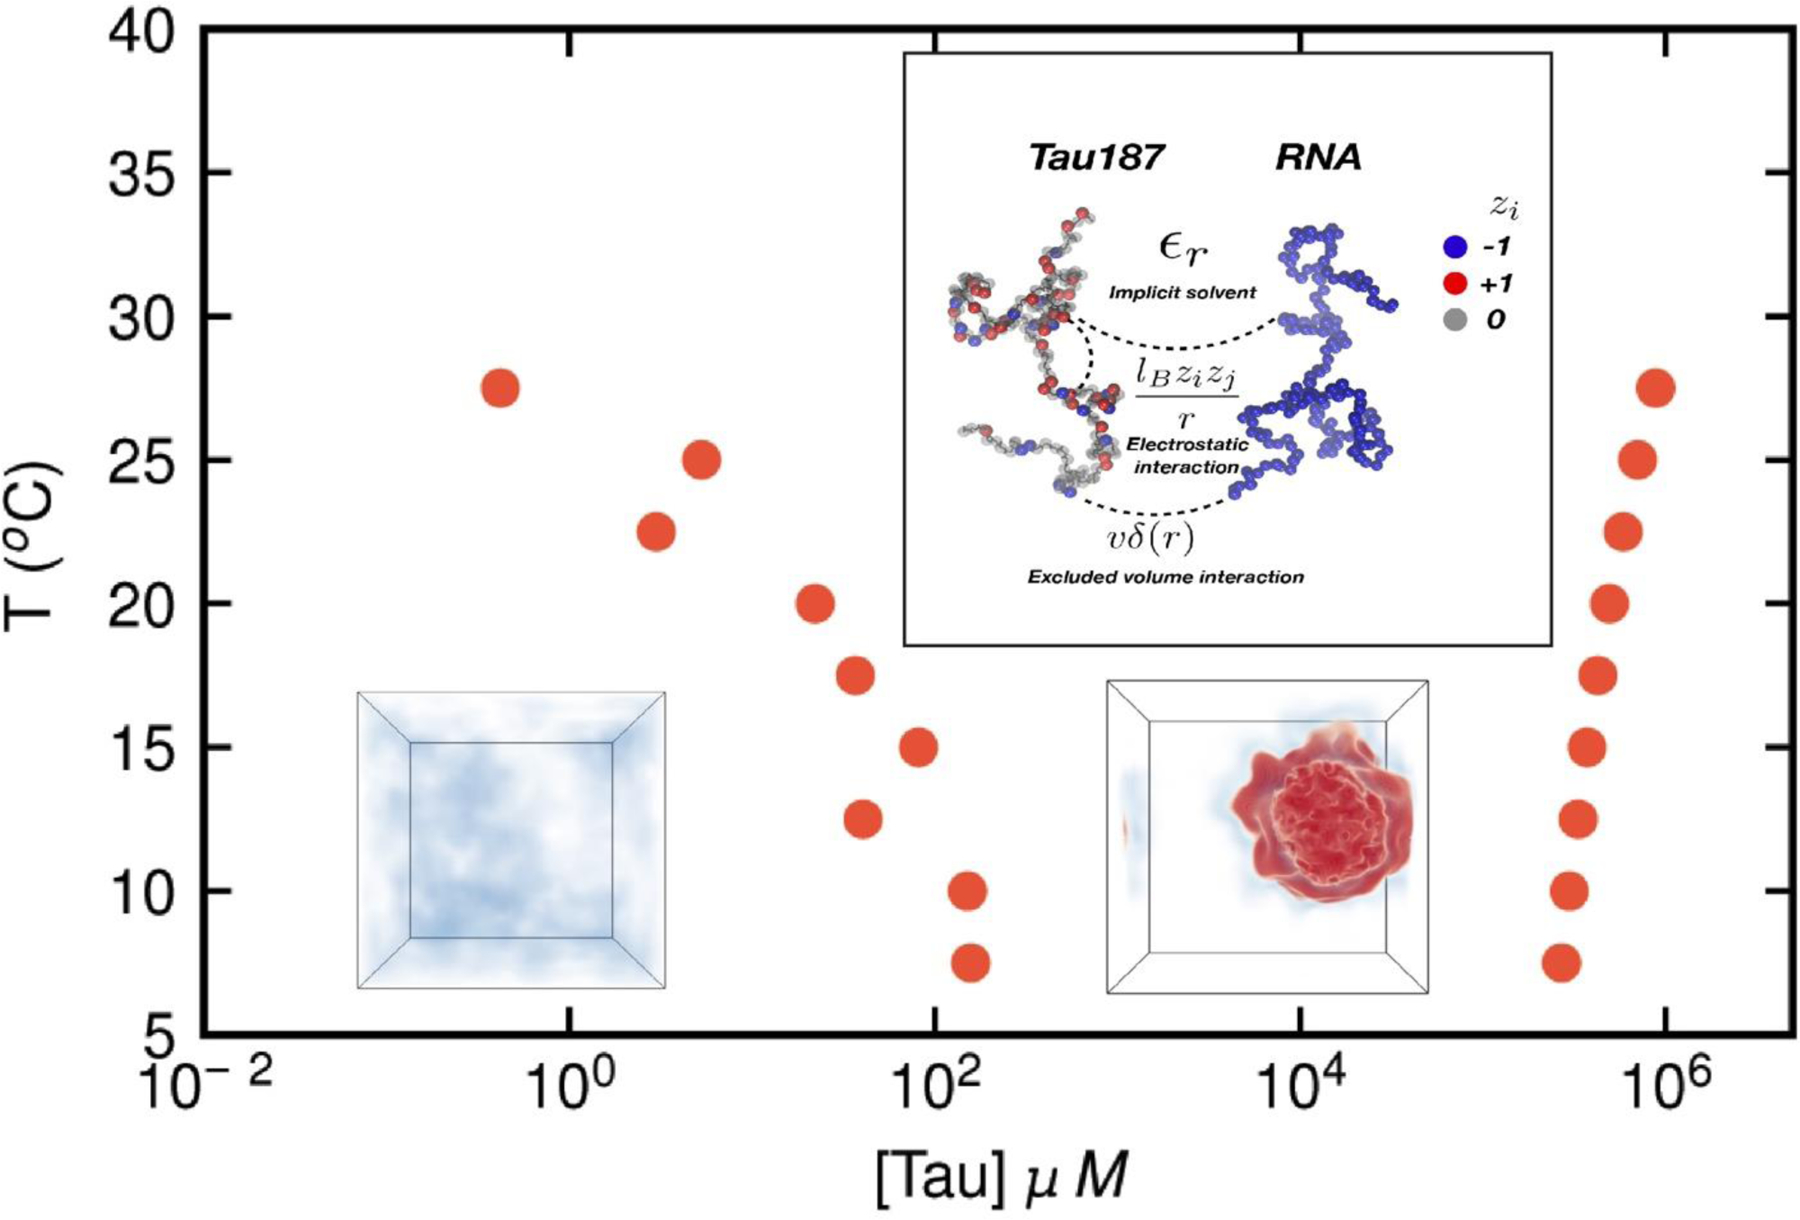
Figure 3.

Field Theoretic Simulations of the LLPS of the Tau protein. The upper inset panel shows the coarse-grained models of Tau and RNA that serve as the input for the FTS-CL simulations. The red circles correspond to the boundaries of the phase diagram. The inner envelope corresponds to the phase separated state (shown by the red density in the FTS-CL snapshot) [63].
