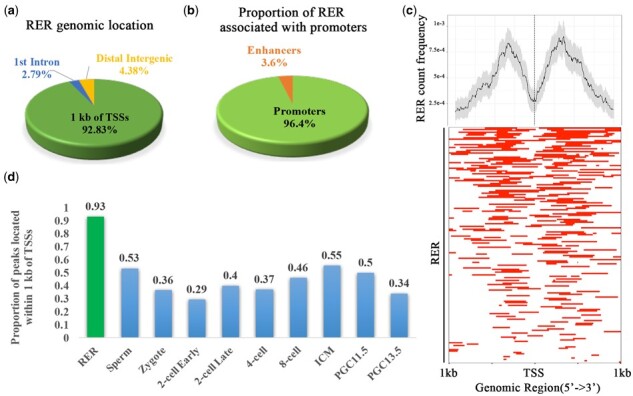
Fig. 2.

Genomic distribution of RERs. (a) Pie chart showing the distribution of RERs across gene features (within a ±1 kb window around TSSs, introns and intergenic regions). (b) Pie chart showing the classification of RERs as promoters or enhancers. (c) Top, Average profile of RERs found within ±1 kb around TSSs [the confidence interval was estimated by the bootstrap method (resample = 1000)]. Bottom, Heatmap of RERs found within ±1 kb around annotated gene TSSs. (d) Proportion histogram showing peaks located within ±1 kb around TSSs, with each bar representing one stage (P-value < 2.2e-14, Chi-square test)
