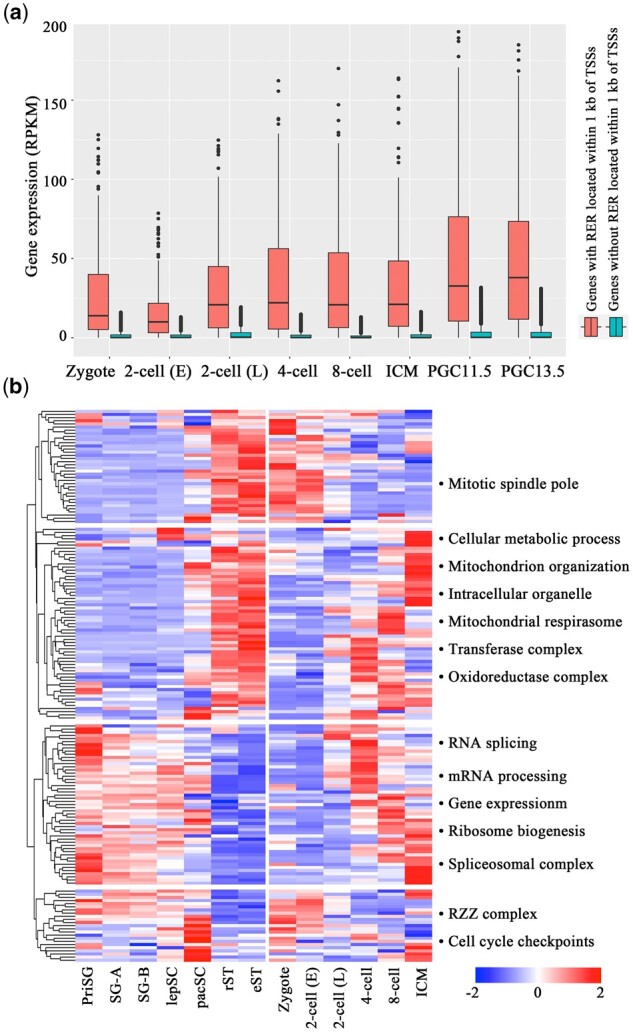
Fig. 3.

Expression patterns of the RER-associated genes. (a) Box plot showing the expression levels of genes with or without RERs in their promoters (±1 kb around the TSS) during embryonic development and in PGCs (P-value < 2.2e-16, Student's t-test). (b) Left, heat map illustrating the expression pattern of genes with RERs in their promoters (±1 kb around the TSS) during spermatogenesis and early embryonic stages. The genes whose expression is upregulated are depicted in red, and those whose expression is downregulated are shown in blue. Hierarchical cluster analysis grouped the genes into four clusters according to their expression levels at different stages. Right panel: the corresponding significantly enriched GO terms for each cluster are shown (FDR < 0.05, Fisher's exact test). priSG (primitive spermatogonia), SG-A (type-A spermatogonia), SG-B (type-B spermatogonia), lepSC (leptotene spermatocytes), pacSC (pachytene spermatocytes), rST (round spermatids), eST (elongated spermatids), 2-cell (E) (2-cell early), 2-cell (L) (2-cell late)
