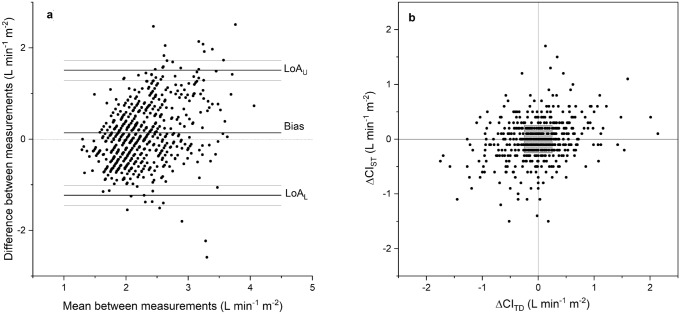
Fig. 1.
a The Bland–Altman plot for cardiac index determined by the bolus thermodilution technique with a pulmonary artery catheter and bioreactance-based Starling SV, all measurement points. The lines for bias, LOA and 95% CIs of LOA are shown. See also Table 2 for exact numbers. b The 4-quadrant method plots the change of consecutive CI measured with Starling SV (ΔCIST) against the change in our reference method thermodilution (ΔCITD) showing the trending ability of Starling SV at all the measurement points. See also Table 2 for exact numbers

