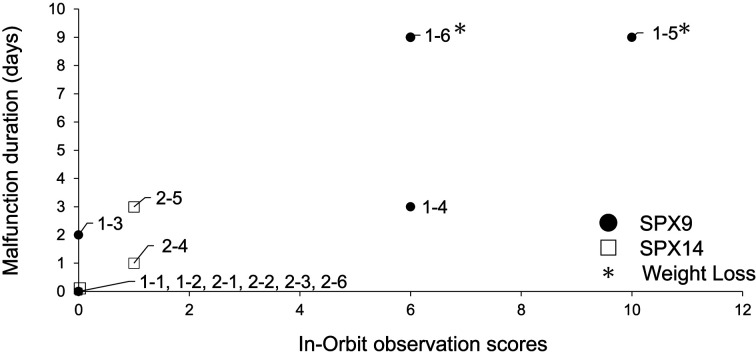
Fig. 3.
Correlation between the duration of malfunction and the on-board observation score. The on-orbit observation score is shown in Table 2, and accumulates the days over which the mice showed abnormalities. The duration of the malfunction was the number of days that the malfunctions were observed. Animals with a change in body weight of more than 1 g between pre and post values are indicated with an asterisk.

