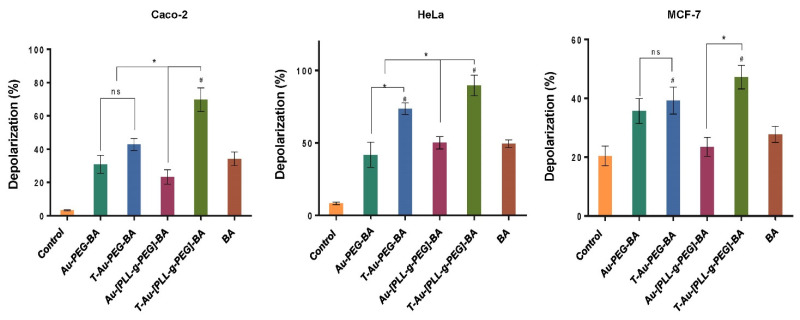
Figure 9.
Graphical representation of the effect of targeted and untargeted nanocomplexes on the mitochondrial membrane potential in Caco-2, HeLa and MCF-7 cells. Data is represented as mean ± SD (n = 3). * vs targeted or untargeted nanocomplex, # vs. free drug at p < 0.05). ns = no significant difference.

